Solution 34858: Graphing Piecewise Functions on the TI-83 Plus and TI-84 Plus Family of Graphing Calculators.
How can I graph piecewise functions on the TI-83 Plus and TI-84 Plus Family of Graphing Calculators?
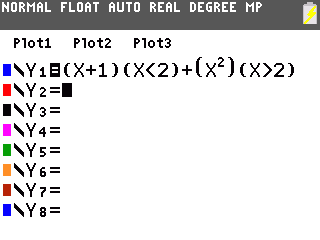
To graph piecewise functions follow the example below:Example: Graph y = x+1; when x<2 and y = x2 when x>2.
1) Press [Y=].
2) Press [(] [X,T, n,q] [+] [1] [)] [(] [X,T,n,q].
3) Press [2ND] [TEST] [5] [2] [)] [+] [(] [X,T,n,q] [x²] [)].
4) Press [(] [X,T,n,q] [2ND] [TEST] [3] [2] [)].
5) Press [GRAPH].
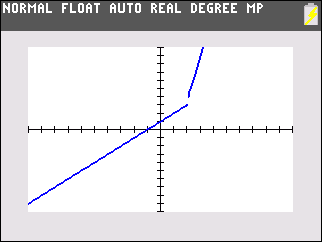
Please Note: If the graph of this function is not displayed, the size of the viewing window on the graph screen may need to be changed. Press [ZOOM] [6] to restore the default WINDOW settings.
Additional Note: If the piecewise functions you are attempting to graph contain “Roots” or “Logarithmic” functions it may not display a graph. To work around this limitation place each piecewise function in a seperate line, for example place the first in Y1 and the second in Y2 etc.
Please see the TI-83 Plus, TI-84 Plus, and TI-84 Plus C Silver Edition guidebooks for additional information.