Solution 34778: Creating a Box Plot on the TI-83 Plus and TI-84 Plus Family of Graphing Calculators.
How do I create a box plot using the TI-83 Plus and TI-84 Plus family of graphing calculators?
The following example will demonstrate how to graph a box plot.
Data for this example:
L1: {3,5,8,10}
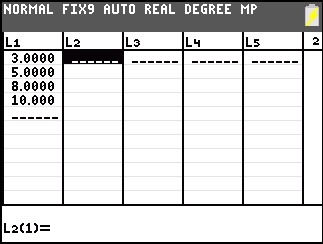
Enter the data:
1) Press [STAT] [ENTER] to enter the statistics list editor.
2) Enter the numbers into L1 by pressing each number followed by [ENTER].
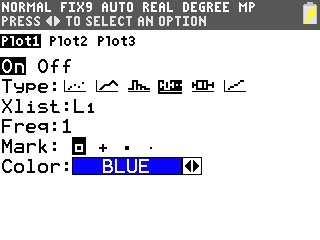
Graph the data:
1) Press [2nd] [STAT PLOT] [ 1 ].
2) Press [ENTER] to turn on the stat plot.
3) Select the box plot (the 4th graph type available in the menu) using the right arrow key and press [ENTER].
4) Be sure that Xlist is L1.
5) Allow Freq to default to 1.
Please Note: Color choice is only available on the TI-84 Plus CE and TI-84 Plus C Silver Edition.
7) Press [GRAPH] to see the Box Plot.
Please Note: Press [ZOOM], select 9:ZoomStat, and press [ENTER] to adjust the window settings.

Please see the TI-83 Plus and TI-84 Plus Family guidebooks for additional information.
Last updated: 6/19/2023