Solution 34717: Graphing Angle Measures on the TI-83 Plus and TI-84 Plus Family of Graphing Calculators.
How do I graph angle measures on the TI-83 Plus and TI-84 Plus family of graphing calculators?
When graphing the measure of an angle, it will be graphed as a system of 2 parametric equations. This is done because the standard function graphing mode is limited to solving for Y= functions in which the "x" is the independent variable and "y" is the dependent variable.
Follow the steps below to graph an angle measure:
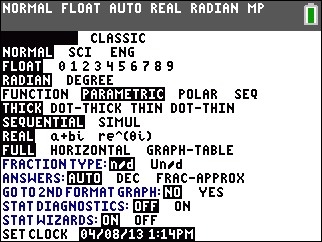
1) Press [mode] then [↓] [↓] [↓] [→] to select PARAMETRIC and press [enter]. This will change the handheld's graphing mode to parametric.
2) Press [ZOOM] [6] to select ZStandard (Zoom Standard). This will set the handheld's graphing window settings to the default values.
3) Press [ZOOM] [5] to select ZSquare (Zoom Square). This will "square up" the graphing window values and reduce distortion.
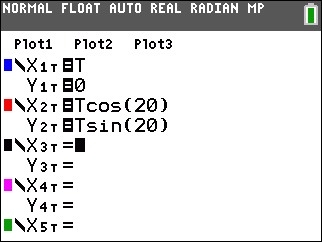
4) Press [Y=] to enter the Y= editor.
5) Enter the following for X1T and Y1T. These equations will define the "base line" to enter "T" press the [X,T,θ,n] key.
X1T=T
Y1T=0
6) Enter the following for X2T and Y2T.
Please Note: This example uses 20° as the angle measure.
X2T=Tcos(20)
Y2T=Tsin(20)
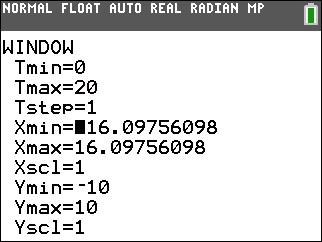
• Press [WINDOW] and check the following settings. Entering the values below will ensure that the angle graphs to the edges of the screen.
Tmin=0
Tmax=20
Tstep=1
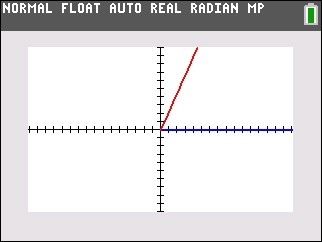
• Press [GRAPH].
Please see the TI-83 Plus and TI-84 Plus Family guidebooks for additional information.
Last updated: 7/05/2023