Solution 34674: Maximizing a Linear Function with the Inequality Graphing Application on the TI-84 Plus CE and TI-84 Plus C Silver Edition.
How can I maximize a linear function with the Inequality graphing application on the TI-84 Plus CE and TI-84 Plus C Silver Edition?
Refer to the example below to maximize a linear function with the Inequality Graphing application.Example: Maximize the profit, P= 3X+2Y, for quantities of two products, X and Y, given the following constraints on materials and time:
X30, Y30
Y+X≥10
3X+Y≥15
Solution:
• Press [APPS] to display the list of applications on the calculator.
• Select Inequal (or Inequalz).
The Inequality Graphing application splash screen is displayed.
• Press any key. The Y=Editor screen is displayed.
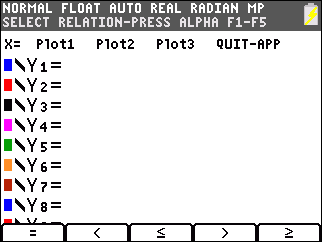
Note that placing the cursor on the = symbol for any Y-variable displays the new relation symbols at the bottom of the screen. To insert a relation symbol, press [ALPHA] plus [F1]-[F5].
• Press [ALPHA][F3] to select ≤.
• Move the cursor to the right of the relation symbol.
• Input 10-X.
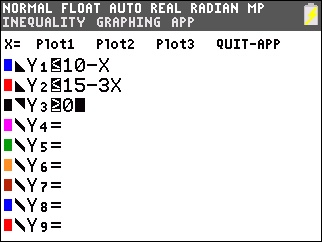
• Enter the relations for Y2 and Y3.
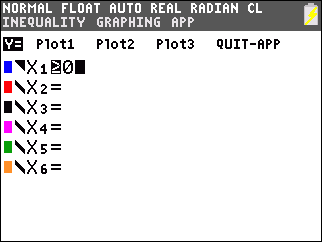
• Move the cursor to X= (in the top left corner).
• Press [ENTER] to access the X=Editor.
• Press [ALPHA][F5] to select ≥.
• Input 0 to store the value to X1.
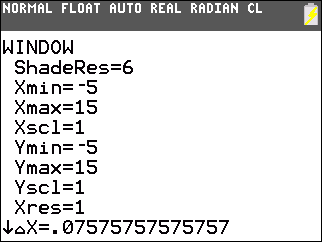
• Press [WINDOW] to set up the graphing window.
• Input the following values for Xmin, Xmax, Ymin, and Ymax:
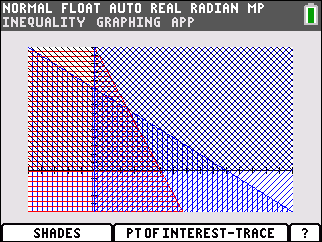
• Press [GRAPH] to graph the selected inequalities.
• Press [ALPHA][F1] to display the SHADES menu.
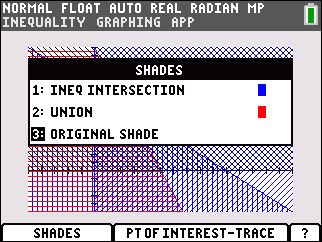
• Select 1:Ineq Intersection.
Note: Inequality Graphing draws the graph again, shading the intersection region of the inequalities.
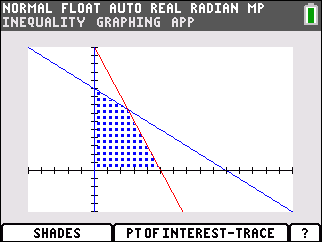
• Press [ALPHA][F3] to select the Pol-Trace option.
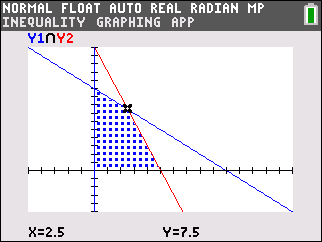
The first point of interest is displayed. The coordinates of the point of interest are displayed at the bottom of the screen. The X-variables and Y-variables that are a part of the intersection are displayed at the top left corner (in this case Y1 and Y2). Press the up or down arrow keys to move from one X or Y function to the next. Press the right or left arrows keys to move from one point to another along the same X or Y function.
• Press the [STO->] key to append the coordinates for the point at the cursor position to the lists LINEQX (x-coordinate) and LINEQY (y-coordinate).
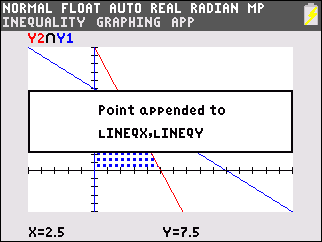
• Press any key to continue.
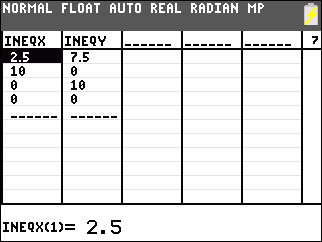
• Find and store the other interest points that bound the shaded area.
• Press [STAT].
• Select 1:Edit.
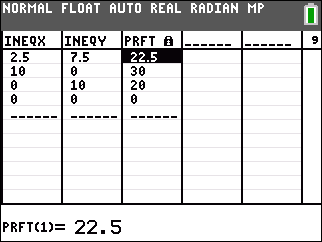
• Insert a new list named PRFT (for profit).
• Add the formula for maximum profit "3*LINEQX+ 2LINEQY" (include the "" marks in the formula).
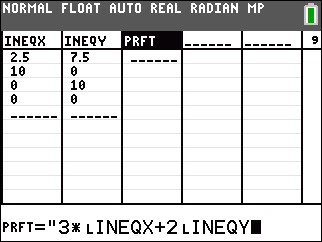
To get LINEQX and LINEQY, press [2nd][LIST] and scroll to select each.
The highest value in PRFT provides the corresponding X (LINEQX) and Y (LINEQY) values to maximize profit.
Please see the TI-84 Plus CE and TI-84 Plus C Silver Edition guidebooks for additional information.