Solution 34651: Graphing Histograms on the TI-83 Plus and TI-84 Plus Family of Graphing Calculators.
How do I graph a histogram on the TI-83 Plus and TI-84 Plus family of graphing calculators?
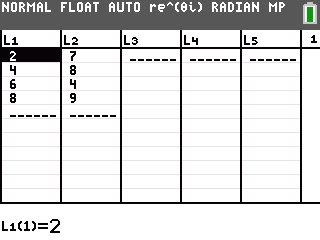
The following example will demonstrate how to graph a histogram.Data for this example:
xStat: {2,4,6,8}
frequency: {7,8,4,9}
Enter the data:
1) Press [stat] [5] [enter] to run the 5:SetupEditor command which will restore default lists
2) Press [stat] [1] to access the STAT list editor
3) Press [↑] [clear] [enter] to clear L1
4) Press 2 [enter] 4 [enter] 6 [enter] 8 [enter] to enter the values in L1
5) Press [↓] [→] [↑] [clear] [enter] to clear L2
6) Press 7 [enter] 8 [enter] 4 [enter] 9 [enter] to enter the values in L2
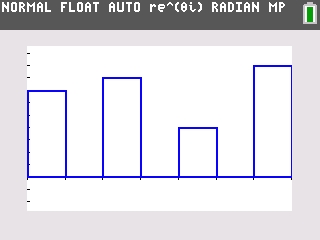
Plot the data:
7) Press [2nd] then [Y=] to access the STAT PLOT editor
8) Press [enter] to begin editing Plot1
9) Press [enter] to turn on Plot1
10) Press [↓] [→] [→] to highlight the option for histogram (3rd option) then press [enter] to select the histogram option
11) Press [↓] [2nd] [1] to enter L1 for "Xlist"
12) Press [↓] [2nd] [2] to enter L2 for "Freq"
13) Press [zoom] [9] to perform a ZoomStat and display the histogram
Please see the TI-83 Plus and TI-84 Plus Family guidebooks for additional information.
Last updated: 7/13/2023