Step-by-step instructions
Standard deviation can be calculated using several methods on the TI-83 Plus and TI-84 Plus Family. Standard deviation can be calculated by using the stdDev() function.
The stdDev() function can be located by performing the following:
1) Press [2nd][LIST].
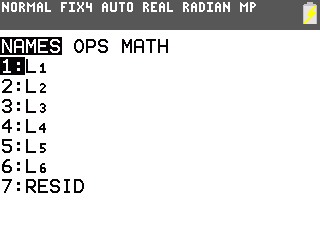
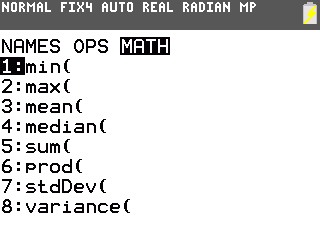
2) Scroll to MATH and select 7:stdDev(.
 Follow the examples listed below to calculate standard deviation of one and two lists of data.
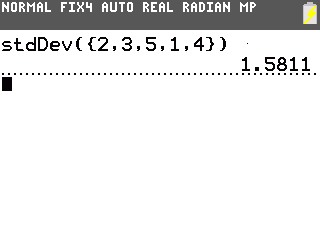
Example: Find the standard deviation of the data list.
List1: 2,3,5,1,4
1) Press [2nd], [LIST], scroll to MATH and select 7:stdDev(.
2) Press [2nd] [{] [2] [,] [3] [,] [5] [,] [1] [,] [4] [2nd] [}] [)].
3) The screen should now display stdDev({2,3,5,1,4}).
4) Press [ENTER] and the standard deviation of the list will be displayed.
 Example:
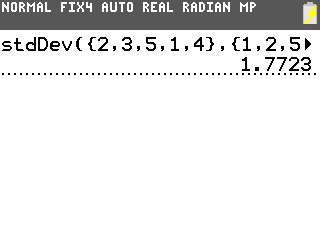
 Find the standard deviation of the two data list.
List1: 2,3,5,1,4
List2: 1,2,5,4,1
1) Press [2nd], [LIST], scroll to MATH and select 7:stdDev(.
2) Press [2nd] [{] [2] [,] [3] [,] [5] [,] [1] [,] [4] [2nd] [{] [)] [,] [2nd] [{] [1] [,] [2] [,] [5] [,] [4] [,] [1] [2nd] [}] [)] 9) The screen should now display stdDev({2,3,5,1,4},{1,2,5,4,1}).
3) Press [ENTER] and the standard deviation of the two lists will be displayed.
 The standard deviation is also calculated and displayed when 1-variable or 2-variable statistics are calculated.
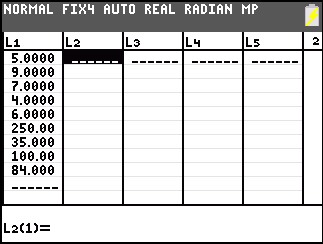
The example below will demonstrate how to calculate 1-variable statistics on the TI-84 Plus C Silver Edition.
x ={5, 9, 7, 4, 6, 250, 35, 100, 84}
1) Press [STAT] [ENTER] to enter the statistics list editor.
2) Enter the data into L1, pressing [ENTER] after each entry.
3) Press [2nd][QUIT] to leave the editor.
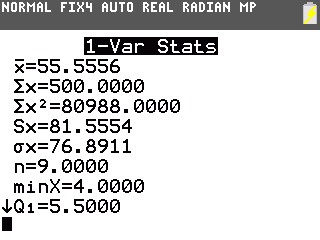
4) Press [STAT], arrow over to CALC, and press 1:1-Var Stats.
5) 1-Var Stats will be displayed on the home screen. Arrow down to Calculate and press [ENTER].
6) The statistics will be displayed (The arrow keys can be used to scroll through the entire list of results).
 The example below will demonstrate how to calculate 2-variable statistics.
Data for this example:
x: {3,5,8,10}
y: {7,2,3,1}
1) Press [STAT] [ENTER] to enter the statistics list editor.
2) Enter the data into L1 and L2, pressing [ENTER] after each entry.
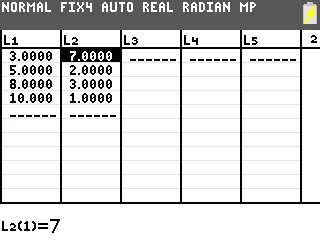
3) Press [2nd][QUIT] to leave the editor.
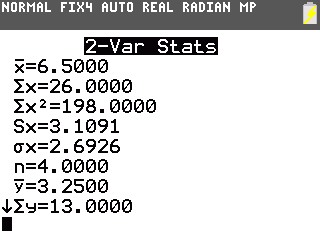
4) Press [STAT], arrow over to CALC, and press 2:2-Var Stats.
5) 2-Var Stats will be displayed on the home screen. Arrow down to Calculate and press [ENTER].
6) The statistics will be displayed (The arrow keys can be used to scroll through the entire list of results).
Please see the TI-83 Plus and TI-84 Plus Family guidebooks for additional information.