Solution 27210: Creating and Viewing a Residual List on the TI-83 Plus family of graphing calculators.
How do I view a residual list on the TI-83 Plus family of graphing calculators?
When the TI-83 Plus family of graphing calculators calculates a regression, there will be a difference between the values of f(x) as calculated and the value as determined by the "best fitting" line. This difference is called a residual.
When regressions are calculated, these residuals are automatically stored within a list called RESID. To view the RESID list, place it into a list in the List editor.
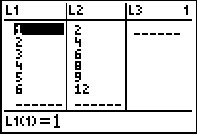
For example, calculate a linear regression for the following values:
L1: {1, 2, 3, 4, 5, 6} L2: {2, 4, 6, 8, 9, 12}
• Press [STAT] [1].
• Press [↑] until cursor is on top line, highlighting L1.
• Press [CLEAR] [ENTER].
• Press [↓] [1] [↓] [2] [↓] [3] [↓] [4] [↓] [5] [↓] [6] [↓].
• Press [→] [↑] [↑] [↑] [↑] [↑] [↑] [↑].
• Press [CLEAR] [ENTER].
• Press [↓] [2] [↓] [4] [↓] [6] [↓] [8] [↓] [9] [↓] [12] [↓].
• Press [2ND] [QUIT]
• Press [STAT] [→].
• Choose [4:LinReg (ax+b)].
• Press [2nd] [L1] [,] [2nd] [L2] [,] [VARS] [→] [1] [1] [ENTER].
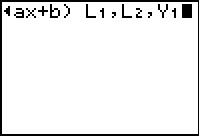
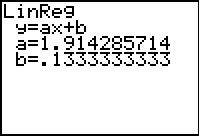
• The linear regression will now be calculated and stored to Y1.
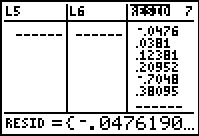
To view the RESID list:
• Press [STAT] [1].
• Press [→] until you get to L6.
• Press [↑] [→].
• Press [2nd] [LIST] to open the List Editor
• Press [↓] until you reach the listname RESID then press [ENTER].
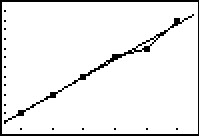
To graph the linear regression along with the statistical data:
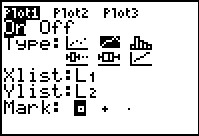
• Press [2nd] [STAT PLOT] [1].
• Use the settings listed in the image below. To change the menu settings use the arrow keys to navigate the options and press the [Enter] key to select an option.
• Press [ZOOM] [9].
Please see the TI-83 Plus Family guidebooks for additional information.