Solution 11928: Calculating One-variable Statistics with Frequencies using a TI-83 Plus Family of Graphing Calculators.
How do I calculate one-variable statistics with frequencies on a TI-83 Plus family of graphing calculators?
The following example will demonstrate how to perform one-variable statistics
with frequencies using a TI-83 Plus family of graphing
calculators:
To enter the data:
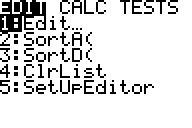
• To enter the STAT edit menu press the [STAT] key and then press the [ 1 ]
key.
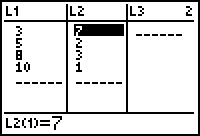
• Enter the data for xList in the L1 {3,5,8,10} and Frequency list in L2
{7,2,3,1} pressing [ENTER] after each entry to move to the next
line.
• Press the [2nd] key then the [QUIT] key to leave the editor to go back to
the home screen. On the home screen press the [CLEAR] key to clear off the home
screen.

To calculate the one-variable statistics:
• First press the [STAT] key then press the [right arrow] key once to enter the CALC menu.
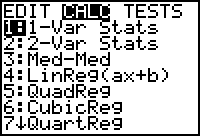
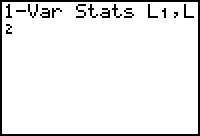
• Next press the [1] key and 1-Var Stats will be typed on the home screen
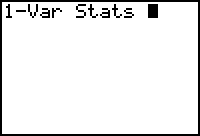
• Next in order input which lists we want to find our 1-Var Stats for, press the [2nd] key, then the [1] key to bring up your L1 list, next press the [,] key to separate your two lists and last press the [2nd] key and the [2] key to bring up your L2 list.
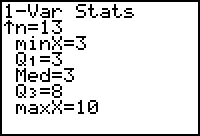
• Last press the [ENTER] key and the statistics will be displayed you can scroll through them using the [up arrow] key and the [down arrow] key.
For additional instructions on performing graph calculations, please see the TI-83 Plus Family guidebooks for additional information.