Solution 11720: Calculating Y-Hat Values on the TI-83 Plus Family of Graphing Calculators.
How do I calculate y-hat values on the TI-83 Plus family of graphing calculators?
After finding the regression equation for a data set, it is helpful to know what y-value the regression equation would predict for any x-value from the data set. This corresponding y-value is denoted y-hat. Y-hat values are calculated by substituting the x-values from the data set into the regression equation.
To calculate y-hat values for a data set follow the example below:
Data for this example:
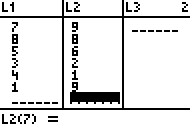
L1: {7,8,5,3,4,1}
L2: {9,8,6,2,1,9}
1) Press [STAT] [1] to access the STAT list editor.
2) Input the data in the L1 and L2 lists, making sure to press [ENTER] after each entry.
3) Press [2nd] [MODE] to QUIT and return to the home screen.
Calculating and storing the regression equation:
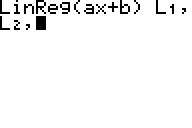
1) Press [STAT], arrow right to highlight CALC and press [4] to select the LinReg(ax+b) function.
2) Press [2nd] [1] [,] [2nd] [2] [,] to input L1,L2,
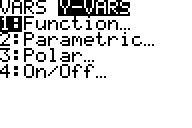
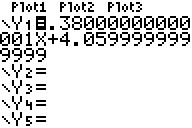
3) Press [VARS], arrow right to highlight Y-VARS and press [1] to select the Y1 function.
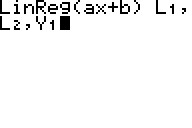
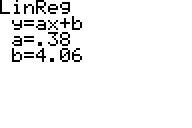
4) Press [ENTER] and the linear regression data will be displayed. The regression equation will also be stored toY1.
Calculating y-hat values:
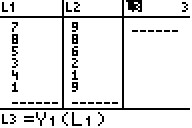
1) Press [STAT] [1] to access the STAT list editor.
2) Scroll over to L3, scroll up to highlight L3 and press [ENTER] to input a formula for the L3 list.
3) Press [VARS], arrow right to highlight Y-VARS and press [1] to select the Y1 function.
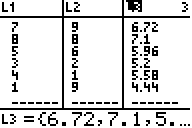
4) Press [ ( ] [2nd] [1] [ ) ] to input (L1). Press [ENTER] to calculate the y-hat values which will be displayed in L3.
Please see the TI-83 Plus Family guidebooks for additional information.