Solution 11366: Maximizing a Linear Function with the Inequality Graphing Application on the TI-83 Plus and TI-84 Plus.
How can I maximize a linear function with the Inequality graphing application on the TI-83 Plus and TI-84 Plus?
Refer to the example below to maximize a linear function with the Inequality Graphing application.Example: Maximize the profit, P= 3X+2Y, for quantities of two products, X and Y, given the following constraints on materials and time:
X30, Y30
Y+X≥10
3X+Y≥15
Solution:
• Press [APPS] to display the list of application on the calculator.
• Select Inequal (or Inequalz).
The Inequality Graphing application splash screen is displayed.
Note that placing the cursor on the = symbol for any Y-variable displays the new relation symbols at the bottom of the screen.
Press [ALPHA plus [F1]-[F5] to insert a relation symbol.
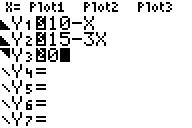
• Press [ALPHA][F3] to select ≤.
• Move the cursor to the right of the relation symbol.
• Input 10-X.
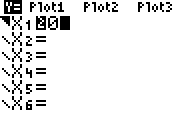
• Move the cursor to X= (in the top left corner).
• Press [ENTER] to access the X=Editor.
• Press [ALPHA][F5] to select ≥.
• Input 0 to store the value to X1.
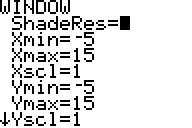
• Input the following values for Xmin, Xmax, Ymin, and Ymax:


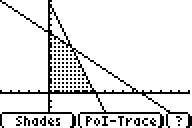
Inequality Graphing draws the graph again, shading the intersection region of the inequalities.
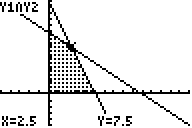
The first point of interest is displayed. The coordinates of the point of interest are displayed at the bottom of the screen. The X-variables and Y-variables that are a part of the intersection are displayed at the top left corner (in this case Y1 and Y2).
Press the up or down arrows keys to move for one X or Y function to the next. Press the right or left arrows keys to move from one point to another along the same X or Y function.
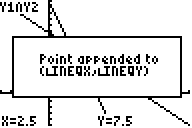
• Press the [STO->] key to append the coordinates for the point at the cursor position to the lists LINEQX (x-coordinate) and LINEQY (y-coordinate).
• Find and store the other interest points that bound the shaded area.
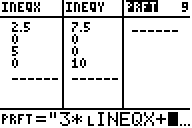
• Press [STAT].
• Select 1:Edit.
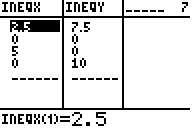
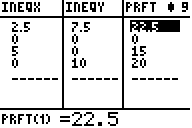
• Add the formula for maximum profit "3*LINEQX+ 2LINEQY" (include the "" marks in the formula).
The highest value in PRFT provides the corresponding X (LINEQX) and Y (LINEQY) values to maximize profit.
Please see the TI-83 Plus and TI-84 Plus guidebooks for additional information.