Solution 11312: Creating a Pie Chart Using the CellSheet™ App on the TI-83 Plus and TI-84 Plus Family of Graphing Calculators.
How do I create a pie chart using the CellSheet App on the TI-83 Plus and TI-84 Plus Family of Graphing Calculators?
The following example will demonstrate how to create a pie chart using the CellSheet App:
The data below represents income spent on a weekly basis:
Week 1 - $400
Week 2 - $350
Week 3 - $475
Week 4 - $300
• Press the [APPS] key and select the "CelSheet" app.
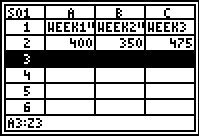
• Create a new spreadsheet using the following data. The titles of week 1 - week 4 will go in A1 - D1. When putting "words" into a cell using the CellSheet App, quotations must be used around the words.
• The amount of money spent each week will go in A2 - D2. So, under A1, input 400, under A2, input 350, etc.
Once the data is input:
• Make sure the cursor is in any single cell and press the [GRAPH] key for Menu
• Press [4] for Charts
• Press [7] for Pie
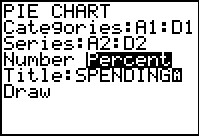
• Next to Categories, input A1:D1. Make sure to include the colon. This specifies the title of each piece of the pie.
• Next to Series, input A2:D2. This specifies the actual numbers the pieces of the pie represent.
• The next choice is for Number or Percent. Number will show the pie chart in actual numbers, such as 400, 350, etc. Percent will show the numbers as a percentage of the pie.
• Finally, give the chart a title. The title can be no more than eight characters.
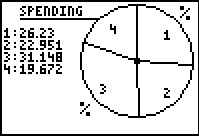
• Select the Draw command to graph the pie chart. Pressing the [TRACE] key will allow scrolling through each piece of the pie, with the title of each piece shown.
Please see the CellSheet App guidebook for additional information regarding the CellSheet app. Users may also refer to the TI-83 Plus and TI-84 Plus family guidebooks for additional information regarding calculator functionality.