Knowledge Base
Solution 34916: Graphing Inequalities on the TI-84 Plus CE and TI-84 Plus C Silver Edition.
How do I graph inequalities on the TI-84 Plus CE and TI-84 Plus C Silver Edition?
The Y= Editor does not allow an inequality to be directly entered into the calculator. However, the graph styles feature can be utilized to show the solution set for an inequality. The example below will demonstrate how to graph a simple inequality using these features.
Example: Graph y<=3x+2.
1) Press the [Y=].
2) Press [3] [X,T,θ,n] [+] [2] on Y1.
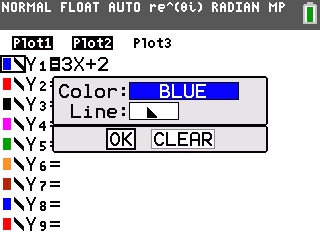
3) Press [◄] six times until the symbol to the left of Y1 is flashing.
4) Press [ENTER] [▼] to select the Line area.
5) Press [►] repeatedly until a triangle pointing to the lower part is displayed.
6) Press [▼] [ENTER].
7) This will change the graph style to shade below the function (this style was chosen because the solution set consists of all real numbers below the line of the y= equation).
8) Press [GRAPH] to graph the solution set.
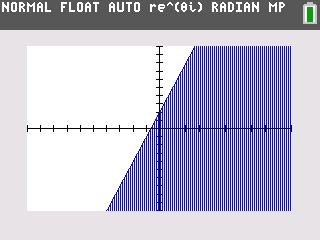
The Inequality Graphing App can also be used to graph this solution.
Please see the TI-84 Plus CE and TI-84 Plus C Silver Edition guidebooks for additional information.