Solution 30350: Using the Two-Graph Mode on the TI-89 Family and Voyage™ 200 Graphing Calculators.
How do I use the two-graph mode on the TI-89 Family and Voyage 200 graphing calculators?
The two-graph mode is a feature where the graph-related features are duplicated, giving two independent graphing calculators. The two-graph mode is only available in split screen mode.
The two graphs in two-graph mode have the following independent functions:
• Graph modes (Function, Polar, etc). Other modes such as Angle, Display Digits,etc., are shared and affect both graphs.
• The Y= Editor is completely independent only when the two sides use different graphing modes. However, the both graphs share common function and stat plot definitions.
• Window Editor variables.
• Table setup parameters and Table screens.
• Graph formats such as Coordinates, Axes, etc.
• Graph screens.
Note: If both sides use the same graphing mode, each side can select different functions from the Y= Editor. Non-graph-related applications (Home screen, Data/Matrix Editor,etc) are shared and can be displayed on only one side at a time.
Setting the Mode
Several mode settings affect the two-graph mode, but only two settings are required. Both are on Page 2 of the MODE dialog box.
To set the modes, please follow the steps below:
• Press [MODE]. Then press [F2] to display Page 2.
• Set the following required modes.
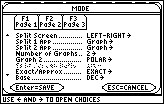
• Split Screen = TOP-BOTTOM or LEFT-RIGHT
• Number of Graphs = 2
• Optional mode settings:
Page 1: Graph = Graph mode for top or left side of the split.
Page 2: Split 1 App = application for top or left side.
Split 2 App = application for bottom or right side.
Graph 2 = Graph mode for bottom or right side.
• Press [ENTER] to close the dialog box.
Example:
Graph the function f(x)=x3+x and the polar equation r=8sin(2.5Ө).
Solution:
• Press [MODE]. Press [F2] to display Page 2.
• Set the Split screen to LEFT-RIGHT.
• Set Split 1 App to Graph.
• Set Split 2 App to Graph.
• Set Number of Graph to 2.
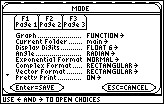
• Set Graph 2 to POLAR
• Press [F1] to display Page 1.
• Set Graph to FUNCTION
• Press [ENTER]
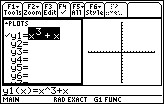
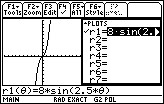
• Press [¨][Y=]
• Input y1=x^3+x .
• Press [ENTER].
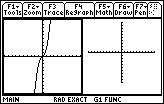
• Press [¨][GRAPH] to display the function graph.
• Press [2ND] and then the [APPS] key to switch to the second split screen.
• Press [¨][Y=]
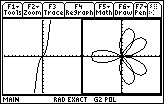
• Input r1=8sin(2.5Ө)
• Press [ENTER]
• Press [¨][GRAPH] to display the polar graph.
Additional information is available in the TI-89 family and Voyage 200 guidebook.