Solution 29130: Calculating and Graphing Quadratic Regressions Using the TI-73 Family Calculator.
How do I calculate and graph a quadratic regression using the TI-73 family calculator?
To calculate and graph quadratic regressions using the TI-73 family calculator, follow the example below.
Please Note: Texas Instruments recommends all TI-73 family users update the calculator to the latest operating system. More information on the latest operating system can be found at the TI-73 Explorer™ latest software website.
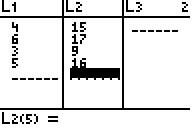
Example Data:
| L1 | L2 | ||||||||
|---|---|---|---|---|---|---|---|---|---|
| 4 | 15 | ||||||||
| 6 | 17 | ||||||||
| 3 | 9 | ||||||||
| 5 | 16 |
1) Press [2nd] [MEM] [6] [ENTER] to clear previous data stored in lists.
2) To begin inputting data, press the [LIST] key.
3) Input the example data in the L1 and L2 lists.
4) Press [2nd] [QUIT] to return to the home screen.
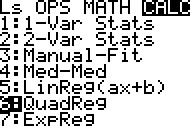
5) Press [2nd] [STAT], scroll over to "CALC", then press [6] to select the "QuadReg" function. This will paste QuadReg on the home screen.
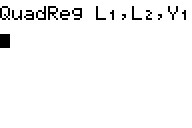
6) Press [2nd] [STAT] [1] to input the L1 list.
7) Press the [,] key.
8) Press [2nd] [STAT] [2] to input the L2 list.
9) Press the [,] key.
10) Press [2nd] [VARS] [2] [1] to select the "Y-Vars" menu and input the Y1 function.
11) Press [ENTER] to calculate the quadratic regression. This will also copy the regression equation to the Y= Editor so that the function can be graphed.
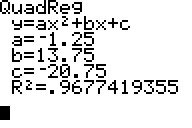
The calculator should display values for the variables a, b, and c. Since the function for the quadratic regression is ax^2 + bx + c, the solution can be interpreted as:
-1.25x^2 + 13.75x - 20.75
Please Note: To display the correlation coefficient (R^2), execute the "DiagnosticOn" function by pressing [2nd] [CATALOG], scrolling down to DiagnosticOn and pressing [ENTER] ENTER].
12) Finally, to graph the quadratic regression function that is now stored to Y1, perform a "ZoomStat" by pressing [ZOOM] [7].
Please see the TI-73 family guidebooks for additional information.