Solution 25870: Setting the Window Range When Graphing the Normal PDF Function Using a TI-89 Family, TI-92 Plus or Voyage™ 200 Graphing Calculator.
How do I get the "ZOOM" functions to show the correct Normal Distribution curve when graphing a Normal PDF function on my TI-89 family, TI-92 Plus or Voyage 200 graphing calculator?
To graph a Normal Distribution curve, and have it display correctly, please follow the WINDOW settings guidelines listed below.
• The Xmin value should be the "Mean" or "Average" value minus 3 or 4 times the "Standard Deviation " value. When using 3 times the Standard Deviation, the Normal Distribution curve will be graphed, however, the "tails" of the graph will not be displayed. When using 4 times the Standard Deviation, the Normal Distribution curve will be graphed and the "tails" of the graph will be displayed.
• The Xmax value should be the "Mean" or "Average" value plus 3 or 4 times the "Standard Deviation " value. When using 3 times the Standard Deviation, the Normal Distribution curve will be graphed, however, the "tails" of the graph will not be displayed. When using 4 times the Standard Deviation, the Normal Distribution curve will be graphed and the "tails" of the graph will be displayed.
• The Xscl value should be the Standard Deviation value.
• The Ymin, Ymax and Yscl values should be set to default (see below). These values will be changed later using the "ZoomFit" function.
Ymin = -10Ymax = 10
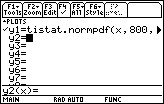
Yscl = 1 Example: Graph a Normal Distribution curve where the Mean (Average) is 800 and the Standard Deviation is 40 by following the steps below. NOTE: To graph a Normal Distribution curve using the TI-89 family, TI-92 Plus or Voyage 200, the Statistics with List Editor application must be installed on the calculator. 1. Press [green diamond] [F1] and make sure no other functions are listed. If so, clear them out by moving the cursor on top of the functions and pressing [CLEAR]. 2. For Y1, input normalpdf(x,800,40). NOTE: To access the normalpdf function, press [CATALOG] [F3] [6], scroll down to "normalPdf(" and press [ENTER].
 3. Press [green diamond] [F2] to access the WINDOW settings. 4. For Xmin, input 680 (Mean minus 3 times the Standard Deviation). This will display the graph without "tails". To see the graph with "tails", input 640 (Mean minus 4 times the Standard Deviation).
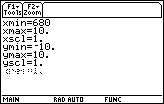
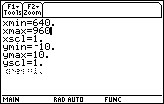
 5. For Xmax, input 920 (Mean plus 3 times the Standard Deviation). This will display the graph without "tails". To see the graph with "tails", input 960 (Mean plus 4 times the Standard Deviation).
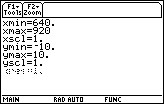
 6. For Xscl, input 40 (Standard Deviation). 7. For Ymin, Ymax and Yscl, input the default values of -10, 10 and 1 respectively. If these values are already present, disregard this step.
 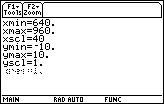 8. Press [F2] [ALPHA] [=] to perform a "ZoomFit". Based on the method used, the graph will be displayed with or without "tails".
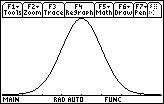
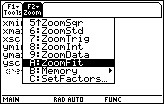
For more information and examples using the TI-89 family, TI-92 Plus and Voyage 200 calculators or the Statistics with List Editor App, please take a look at the TI-89/TI-92 Plus guidebook, TI-89 Titanium/Voyage 200 guidebook or the Statistics with List Editor App guidebook.