Solution 15346: Graphing 2D Implicit Functions on the TI-89 Titanium, TI-92 Plus, and Voyage™ 200.
How can I graph a function in implicit form on the TI-89 Titanium or Voyage 200?
In 2D function graphing mode, it is not possible to graph functions that have an implicit form f(x,y)=g(x,y). For example, the functionx^2+.5y^2=30 is a implicit function. Only equations having an explicit form y=f(x), where y is unique for each x value can be graphed in this mode.
However, by using 3D graphing mode, it is possible to graph implicit 2D without solving for y or x. To be able to graph these functions, users will need to rearrange the implicit form as an equation set to zero f(x,y) - g(x,y)=0. Then enter the non-zero side into the Y= editor.
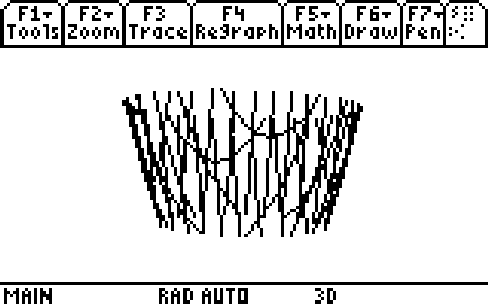
Example: Graph the function x^2+.5y^2=30 without solving for x or y.
Follow the steps below:
• Press [MODE]. The Graph setting should be blinking.
• Press the right arrow key.
• Select 5: 3D and press [ENTER][ENTER].
• Press the green diamond key and then [F1].
• Next to z1(x,y)= input x^2+.5y^2-30.
• Press [F1].
• Select 9: Format and press [ENTER] to display the GRAPHFORMATS dialog box..
• Set Style = IMPLICIT PLOT.
• Press the green diamond key and then [F3] to display the graph.
Notes:
• Graphing implicit functions this way takes a long time.
• Change the format style to WIRE FRAME if the function is taking a very long time to graph.
• It is not possible to trace an implicit plot.
For additional instructions, refer to the online guidebook for your calculator.