Solution 12113: Calculating 1-Variable Statistics with Frequencies on the TI-89 Family, TI-92 Plus and Voyage™ 200 Graphing Calculators.
How do I calculate 1-variable statistics with frequencies on my TI-89 family, TI-92 Plus or Voyage 200 graphing calculator?
Refer to the example below to calculate 1-variable statistics with frequencies on the TI-89 family, TI-92 Plus and Voyage 200 graphing calculators.
Example:
x values: 5, 8, 9, 12, 13, 15
Frequencies: 4, 1, 5, 2, 6, 3
Input the data:
1) Press [APPS] [6] [3]. (If the Apps Desktop is on, select Data/Matrix Editor, and choose [3]).
2) Press the down arrow twice.
3) In the box beside variable type a variable name. (e.g. TEST).
4) Press [ENTER] [ENTER].
5) Enter the numbers for the x values under c1. Press [5][ENTER][8][ENTER] etc.
6) Enter the numbers for the frequencies under c2.
Calculate the statistics:
1) Press [F5] for Calc.
2) Select 1:OneVar.
3) Scroll to the X... field and input c1.
4) Scroll to Use freq and Categories? and select. 2:YES.
5) Now, scroll to the Freq field and input c2.
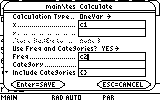
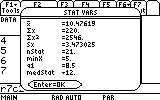
6) Finally, press [ENTER] [ENTER] and the one-variable statistics with frequencies will be displayed.
Please see the TI-89 family, TI-92 family and Voyage 200 guidebooks for additional information.