Solution 12092: Creating a Scatter Plot Using the TI-89 Family, TI-92 Family, and Voyage™ 200 Graphing Calculators.
How do I create a scatter plot using the TI-89 family, TI-92 family, and Voyage 200 graphing calculators?
The following example will demonstrate how to create a scatter plot using the TI-89, TI-92 Family, and Voyage 200.
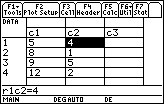
Data for example:
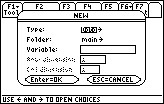
Access the data matrix editor:
1) Press [APPS] [6] [3] (If the Apps Desktop is on, press [APPS], select Data/Matrix Editor, and choose [3].)
2) Scroll to Variable: and type in a name.
3) Press [ENTER] two times.
Enter X and Y values:
1) Under c1 enter the X values, press [ENTER] after each entry.
2) Under c2 enter the Y values, press [ENTER] after each entry.
Graph the data:
1) Press [F2].
2) Press [F1].
3) Select plot type (use scatter to plot the points).
4) Type in c1 for X and c2 for Y.
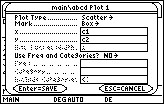
5) Press [ENTER] two times.
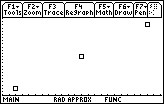
6) Press [♦] [GRAPH] (Note: The viewing window may need to be adjusted. Press [F2][9].)
Please see the TI-89 family, TI-92 family and Voyage 200 guidebooks for additional information.