Solution 12091: Creating a Histogram Using the TI-89 Family, TI-92 Family, and Voyage™ 200 Graphing Calculators.
How do I plot a histogram using the TI-89 family, TI-92 family, and Voyage 200 graphing calculators?
The following example will demonstrate how to plot a histogram using the TI-89, TI-92 Family, and Voyage 200.Data for this example:
x values: {5, 8, 9, 12, 13, 15}
Frequencies: {4, 1, 5, 2, 6, 3}
Input the data
• Press [APPS] [6] [3]. (If the Apps Desktop is on, press [APPS], select Data/Matrix Editor, and choose [3].)
• Press the down arrow twice.
• In the box beside variable type a variable name. (e.g. TEST)
• Press [ENTER] [ENTER].
• Enter the numbers for the x values under c1. Press [5] [ENTER] [8] [ENTER] etc.
• Enter the numbers for the frequencies under c2.
Graph the Histogram
• Press F2 (Plot Setup).
• Press F1 (Define).
• A screen will now show the dialog box with the stat plot options. Fill in the following options.
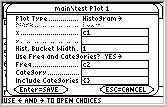 • Press [ENTER] [ENTER] to save these settings.
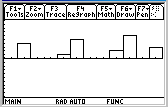
• Press [diamond key] [GRAPH] to view the graph. It may be necessary to change the current viewing window by pressing [F2] [9] for a ZoomData fit.
Note: What do if I get the error message "Plot Setup" when setting up a Histogram using Stats/List Editor?
The error message "Plot Setup" appears when entering a histogram with a list of large values. This is because the Stats/List Editor Program does not change the Histogram Bucket Width automatically. The Bucket Width variable must be entered manually and must be a value proportionate to the in the lists.
Please see the TI-89 family, TI-92 family and Voyage 200 guidebooks for additional information.