Solution 12090: Creating a Box Plot using the TI-89 Family, TI-92 Family, and Voyage™ 200 Graphing Calculators.
How do I create a box plot using the TI-89 family, TI-92 family, and Voyage 200 graphing calculators?
The following example will demonstrate how to plot a box plot using the TI-89 family, TI-92 family, and Voyage 200.
x values: 5, 8, 9, 12
Frequencies: 4, 1, 5, 2
Input the data:
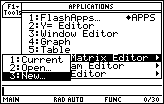
1) Press [APPS] [6] [3]. If the Apps Desktop is on, press [APPS], select Data/Matrix Editor, and choose [3].

2) Press [▼] [▼] [T] [E] [S] [T].
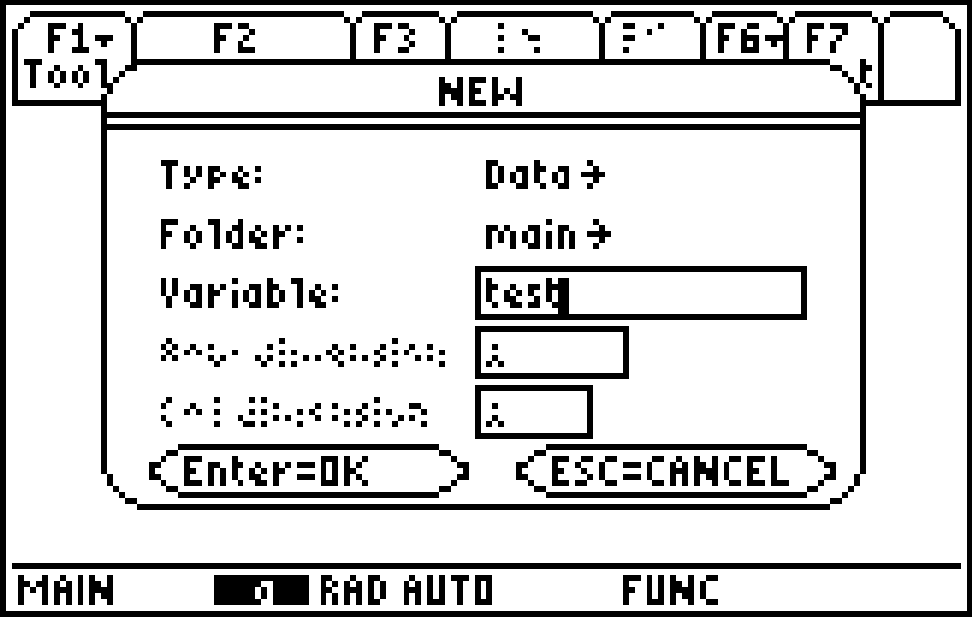
3) Press [ENTER] [ENTER].
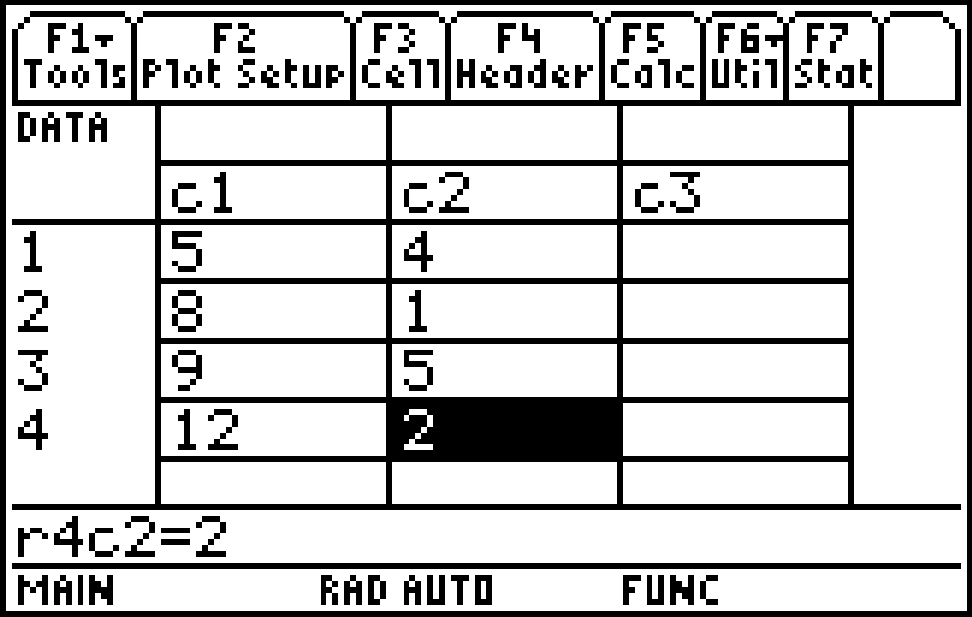
4) Press [5] [ENTER] [8] [ENTER] [9] [ENTER] [1] [2] [ENTER].
5) Press [►] [▲] [▲] [▲] [▲].
6) Press [4] [ENTER] [1] [ENTER] [5] [ENTER] [2].
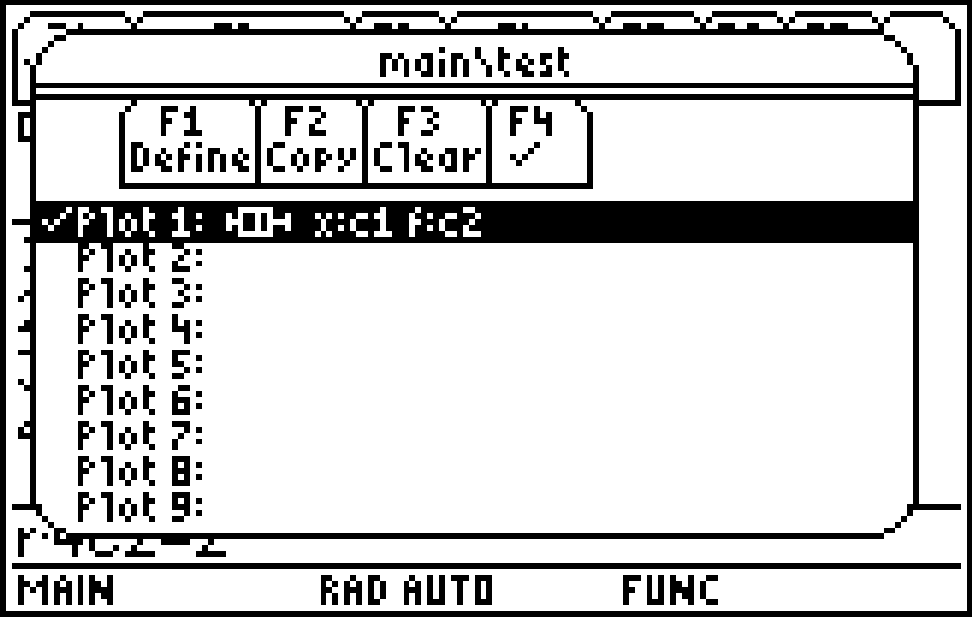
7) Press [F2] [F1].

8) Press [►] [3] [▼] [C] [ALPHA] [1] [▼] [►] [2] [▼] [ALPHA] [C] [2]. Please note that users with TI-92 family or Voyage 200 graphing calculators may omit pressing [ALPHA] in this or any other step.
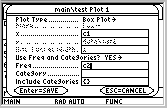
9) Press [ENTER].
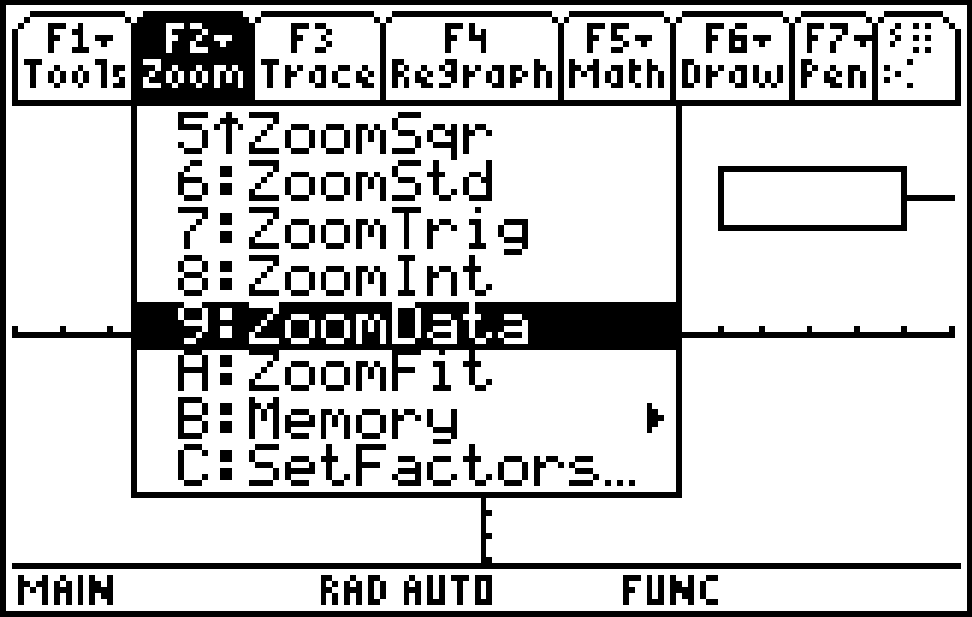
10) Press the [◊] [GRAPH] [F2] [9].
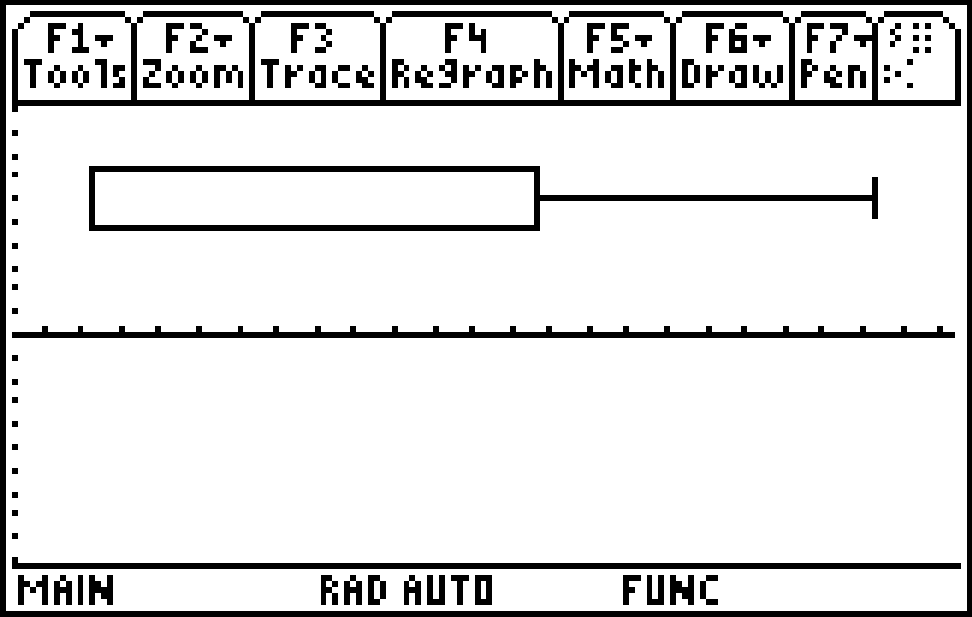
Please see the TI-89 family, TI-92 family and Voyage 200 guidebooks for additional information.