Solution 11764: Graphing a Function and the Slope Field Based on that Function using a TI-89 Titanium, TI-92 Plus or Voyage™ 200 Graphing Calculators.
How can I graph a function and the slope field based on that function using my TI-89 Titanium, TI-92 Plus or Voyage™ 200 graphing calculators?
These calculators cannot graph a function and differential equation on the same screen at the same time. However, it is possible to graph both at the same time using the split screen function of the TI-89 Titanium, TI- 92 Plus and the Voyage 200 graphing calculators. To do this follow the steps listed below:
• Press [MODE]
• Change Graph to Function.
• Press Enter to save the changes.
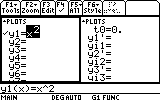
• Go to Y= and type in the function. For example, use y=x^2.
• Press [MODE]
• Press [F2].
• Change Split Screen to Left-Right.
• Change Split Screen 1 App to Y= Editor.
• Change Split Screen 2 App to Y= Editor.
• Change Number of Graphs to 2.
• Change Graph 2 to Diff Equations.
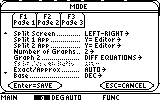
• Press Enter to save the changes.
The left-hand side of the screen should show the y= screen, and the right-hand side should show the y1' screen.
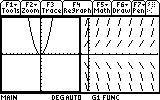
• Press [GREEN DIAMOND] and [GRAPH] to graph the y= function.
• Press [2nd] and [APPS] to switch to the other screen.
• Next to y1'= type y1 (if there is an initial conditions, please remember to type it in Yi1=).
• Press [GREEN DIAMOND] and [GRAPH] to graph the Diff Equations function.
At this point there should be the graph of the function on the left, and the slope field on the right.