Solution 10455: Equations Used to Create the Graphs on the TI-92 Plus Manual.
What equations were used to create the graphs on the TI-92 Plus manual?
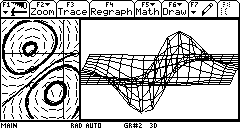
The graphs on the manual used the following equations and settings.MODE setting (Press [MODE])
Graph...DIFF EQUATIONS
Split Screen...LEFT-RIGHT
Split 1 App...Y= Editor
Split 2 App...Y= Editor
Number of graphs...2
Graph 2...3D
Split Screen Ratio...1:2
Left Graph
Input the left side of the graph that is a 2nd order ordinary differential equation (ODE).
Y= Editor (Press [Diamond][Y=])
y1´= 3*(1-y1)*(-2*y2-2)*e^(-y1^2-(y2+1)^2) + 8*y2*e^(-(y1+1)^2-y2^2)
yi1= {.4, -1, -1, -1, -.5}
y2´= 3*e^(-y1^2-(y2+1)^2) + 6*y1* (1-y1)*e^(-y1^2-(y2+1)^2) + 4*(-2*y1-2)*e^(-(y1+1)^2-y2^2)
yi2= {0, 0, -.5, -1, -1}
WINDOW setting (Press [♦][WINDOW])
t0=0
tmax=30
tstep=.1
tplot=0
xmin=-2
xmax=.5
xscl=1
ymin=-2
ymax=1
yscl=1
ncurves=0
diftol=.0001
fldres=30
GRAPH FORMAT (Press [F1][9])
Coordinates: RECT
Solution Method: RK
Fields: DIRFLD Press [Diamond][GRAPH]. Note: The graph takes several minutes to plot.
Right Graph
Input the right side of the 3D graph. (Press [2nd][APPS])
Y= Editor (Press [♦][Y=])
z1= 3*(1-x)*e^(-x^2-(y+1)^2) - 4*e^(-(x+1)^2-y^2)
WINDOW setting
eyeq=174
eyef=108
eyey=2
xmin=-3
xmax=2
xgrid=14
ymin=-3
ymax=2
ygrid=14
zmin=-3.2
zmax=3.2
ncontour=6
Press [Diamond][GRAPH] for the graph. If the graph looks smaller than expected, press the multiplication key to expand the graph.