Solution 10371: Calculating and Graphing a Linear Regression on the TI-82.
How do I calculate and graph a Linear Regression on the TI-82?
The following example will demonstrate how to calculate and graph a linear regression using the TI-82:
Data for this example:
xStat: {3,5,8,10}
yStat: {7,8,14,18}
Enter the data into the TI-82:
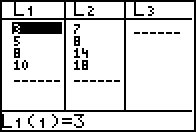
1) Enter STAT edit mode by pressing [STAT] [1].
2) Enter the data in the L1 and L2 lists, pressing enter after each entry.
3) Press [2nd] [QUIT] to leave the editor.
Calculate the linear regression (ax+b):
1) Enter the STAT mode again by pressing [STAT].
2) Select CALC.
3) Press [5] to select LinReg(ax+b).
4) Now tell the graphing calculator which lists to use for the regression, press [2nd] [L1] [,] [2nd] [L2].
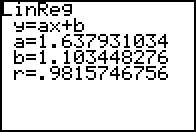
5) Press [ENTER] to perform the regression calculation.
The TI-82 will display the form of the equation (y=ax+b) and then list the values for the two coefficients (a and b).
Graph the data:
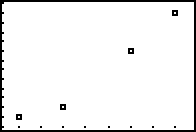
1) Press [2nd] [STAT PLOT] [1].
2) Press [ENTER] to turn on the stat plot.
3) Be sure that xlist is L1 and ylist is L2 4.
4) Press [GRAPH] to display the data. Note: it may be necessary to change the window view.
Graph the linear regression:
1) Press [Y=].
2) Press [VARS] [5] scroll to EQ press [7].
3) Press [GRAPH]
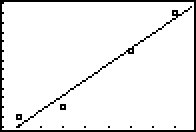
.