
Beer's Law Data Collection Lab
Science: Chemistry: Atomic Structure and Periodic Table
9-12
50 Minutes
TI-Nspire™ CX series
TI-Nspire™ CX CAS/CX II CAS
3.6
Sensor - Colorimeter
- Two burettes
- Double burrette clamp
- Ring stand
- Wash bottle & distilled water
- One cuvette
- Test tube rack & five (5) 20X150 mm test tubes
- Stirring rod
- KimWipes or tissues (preferably lint-free)
- 5 mL of “NiSO4” unknown solution (for example-55 mL of “stock” solution and 45 mL of water-0.22 M)
- 8-9 drops of green food coloring per liter of water to mimic 0.40 M NiSO4. (Nickel is a carcinogen, so the green food coloring is an excellent substitute.) Check the absorbance of this stock solution to be certain it falls in the range of 0.40 to 0.80.
Lessons
Data Collection
TNS
Beer's Law Data Collection Lab
Activity Overview
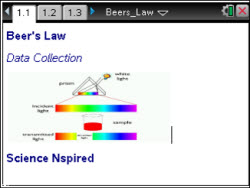
In this lesson, students will use a Colorimeter to discover the relationship between absorbance and concentration of a solution to ultimately determine an unknown solution.
Objectives
- Students will make a serial dilution of a NiSO4 standard solution.
- Students will use a Colorimeter to measure the absorbance value of each standard solution.
- Students will find the relationship between absorbance and concentration of a solution.
- Students will use the results of this experiment to determine the unknown concentration of another NiSO4 solution.
Vocabulary
- Colorimeter
- transmittance
- absorbance
- slope
- y-intercept
- correlation coefficient
About the Lesson
This lesson involves absorbance data for solutions of various concentration.
As a result, students will:
- Become familiar with TI-NspireTM technology and the Vernier DataQuestTM application.
- Use this graph to make conclusions about the experiment.
- Use a Colorimeter to make measurements.
- Analyze a graph of the data.
You may want to have students create a Lab Report using TI-Nspire following this lab activity. A sample lab report is provided in the downloads.
Download Files
Science: Chemistry: Atomic Structure and Periodic Table
9-12
50 Minutes
TI-Nspire™ CX series
TI-Nspire™ CX CAS/CX II CAS
3.6
Sensor - Colorimeter
- Two burettes
- Double burrette clamp
- Ring stand
- Wash bottle & distilled water
- One cuvette
- Test tube rack & five (5) 20X150 mm test tubes
- Stirring rod
- KimWipes or tissues (preferably lint-free)
- 5 mL of “NiSO4” unknown solution (for example-55 mL of “stock” solution and 45 mL of water-0.22 M)
- 8-9 drops of green food coloring per liter of water to mimic 0.40 M NiSO4. (Nickel is a carcinogen, so the green food coloring is an excellent substitute.) Check the absorbance of this stock solution to be certain it falls in the range of 0.40 to 0.80.
Lessons
Data Collection
TNS
iPad is a trademark of Apple Inc., registered in the U.S. and other countries.
Vernier EasyData,Vernier EasyLink and Vernier EasyTemp are registered trademarks of Vernier Science Education.
Vernier EasyData,Vernier EasyLink and Vernier EasyTemp are registered trademarks of Vernier Science Education.