
Modeling QB Passing Rates
9-12
TI-Nspire™ CX CAS
Modeling QB Passing Rates
This activity uses the measures commonly collected for football quarterbacks and provides an opportunity for students to create their own quarterback rating models.
- Students will model a contextual situation mathematically and use the model to answer a question.
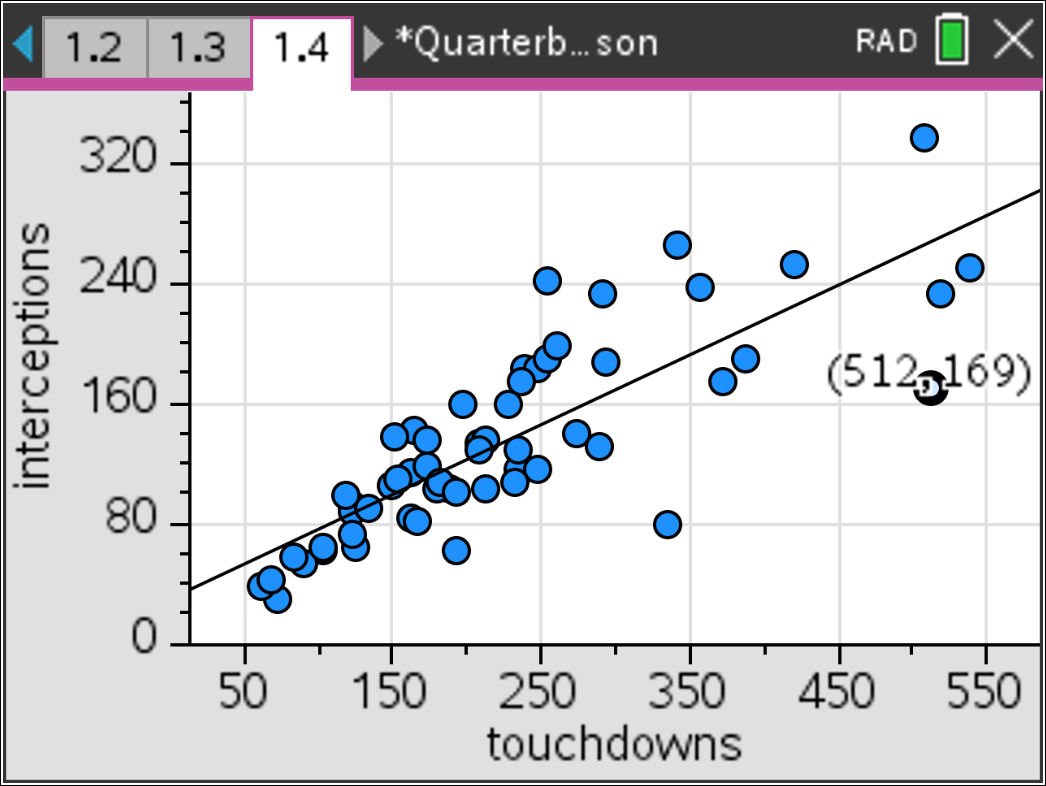
- Students will represent data on two quantitative variables on a scatter plot, and describe how the variables are related.
- Students will find and interpret linear equations to model relationships between two quantitative variables.
- Students will use proportional relationships to solve real-world and mathematical problems.
Who is the GOAT (greatest of all time) among past and current NFL quarterbacks? Many passing statistics are gathered for quarterbacks, including numbers of passing attempts, completed passes, yards gained, touchdown passes, and on the negative side, interceptions. How can all this information be combined in a way that allows us to give each quarterback a single numerical rating that could be used to compare and rank different quarterbacks? Students will use the provided data to build models.
The activity can be used with introductory algebra students, and lends itself to a group project assignment. There are nice connections to averages and ratios as a tool for analyzing information, in particular for accounting for the difference in the units associated with the data. The rating formula is a good example of a multi-variable function, and its structure is easily analyzed. The activity could also be adapted for middle school students by using a smaller subset of the list of players.
9-12
TI-Nspire™ CX CAS
Vernier EasyData,Vernier EasyLink and Vernier EasyTemp are registered trademarks of Vernier Science Education.