
Euler's Method
TI-Nspire™ CX CAS
Euler's Method
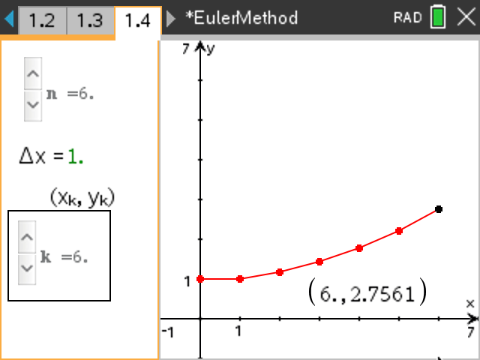
Dynamic graphical representation of Euler's method that can be plotted one step at a time.
- See a dynamic graphical representation of Euler's method that can be plotted one step at a time
The Eulers_Method.tns TI-Nspire document provides a graphical tool for visualizing an approximate solution to differential equations. Euler’s method is motivated by the idea of “local linearity”—a differentiable function behaves very much like a linear function on small intervals. Using that idea, if you know the value of the derivative of a function at a single point, then you can approximate a small portion of its graph with a straight line segment at that point, having the required slope. Given a differential equation and an initial condition, you have the information needed to approximate a small part of the graph. If (x0, y0) is the initial condition, then you can approximate a y-value y1 on the solution curve corresponding to x1 = x0 + ∆x. Now you can repeat this strategy, treating (x1, y1) as a new point on the solution curve. Repeating this process over and over again yields Euler’s method.
TI-Nspire™ CX CAS
Vernier EasyData,Vernier EasyLink and Vernier EasyTemp are registered trademarks of Vernier Science Education.