
Science TODAY™ - Hurricane Damage
Science: Physics: Work, Energy and Momentum
Science: Environmental Science: Energy
9-12
45 Minutes
TI-84 series
Lessons
Science TODAY™ - Hurricane Damage
Activity Overview
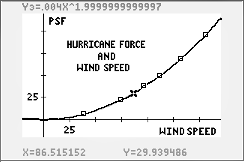
Students will construct a graph and a regression model which shows the relationship between wind speed and the force of the wind. The students will then analyze the math model that fits the data to make predictions from the model.
Download Files
Science: Physics: Work, Energy and Momentum
Science: Environmental Science: Energy
9-12
45 Minutes
TI-84 series
Lessons
iPad is a trademark of Apple Inc., registered in the U.S. and other countries.
Vernier EasyData,Vernier EasyLink and Vernier EasyTemp are registered trademarks of Vernier Science Education.
Vernier EasyData,Vernier EasyLink and Vernier EasyTemp are registered trademarks of Vernier Science Education.