
Working Hard or Hardly Working?
Math: Algebra I: Data Analysis
6-8
9-12
9-12
45 Minutes
TI Connect™ CE
TI-84 series
Lessons
Working Hard or Hardly Working?
Activity Overview
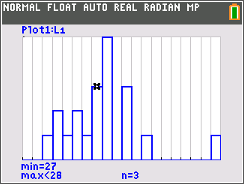
Students analyze univariate and bivariate data.
Download Files
Teacher Files
Math: Algebra I: Data Analysis
6-8
9-12
9-12
45 Minutes
TI Connect™ CE
TI-84 series
Lessons
iPad is a trademark of Apple Inc., registered in the U.S. and other countries.
Vernier EasyData,Vernier EasyLink and Vernier EasyTemp are registered trademarks of Vernier Science Education.
Vernier EasyData,Vernier EasyLink and Vernier EasyTemp are registered trademarks of Vernier Science Education.