Modeling: Optimal Locations for a Food Truck

9-12
TI-Nspire™ CX
Modeling: Optimal Locations for a Food Truck
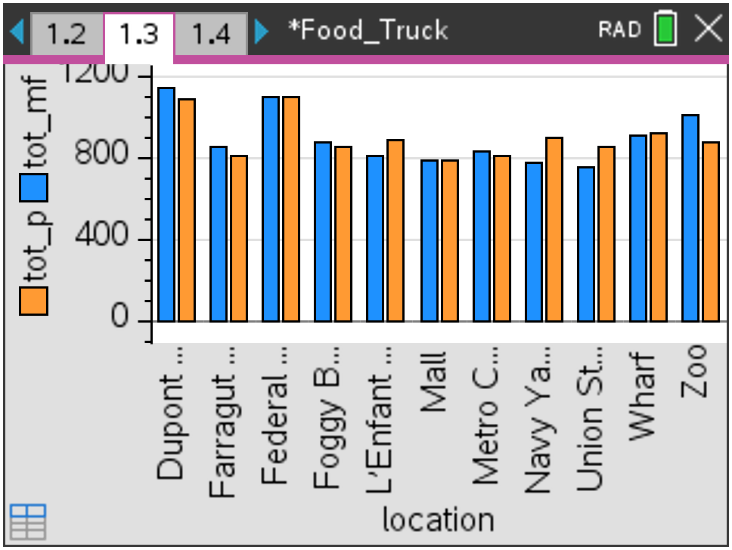
In this activity, students will investigate where to locate a food truck in Washington DC to maximize the number of potential customers.
Students will be able to:
- Recognize the value of using data to make informed decisions
- Identify strategies for standardizing values of variables representing different units and different magnitudes
- Understand that different graphical representations can reveal different information about the context
- Identify strategies for using multiple variables in analyzing situations
This activity is designed to involve students in considering a variety of data that can be used to make a decision. Analyzing the data can involve graphs, fractions, proportional reasoning, linear equations, and basic notions of probability. The fourth example of student work illustrates an application of z-scores for students who are familiar with statistics.
9-12
TI-Nspire™ CX
Vernier EasyData,Vernier EasyLink and Vernier EasyTemp are registered trademarks of Vernier Science Education.

