
Comparing Box Plots
Math: Statistics: Displaying and Describing Univariate Data
9-12
15 Minutes
TI-Nspire™ CX series
2.0
Lessons
TNS
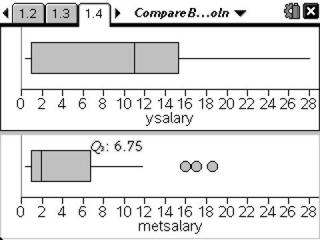
Comparing Box Plots
Activity Overview
Students are given two real world data sets to compare. First students will inspect the lists of data and visually compare the lists to make preliminary conclusions.
Download Files
Teacher Files
Student Files
Math: Statistics: Displaying and Describing Univariate Data
9-12
15 Minutes
TI-Nspire™ CX series
2.0
Lessons
TNS
iPad is a trademark of Apple Inc., registered in the U.S. and other countries.
Vernier EasyData,Vernier EasyLink and Vernier EasyTemp are registered trademarks of Vernier Science Education.
Vernier EasyData,Vernier EasyLink and Vernier EasyTemp are registered trademarks of Vernier Science Education.