Find answers to the top 10 questions parents ask about TI graphing calculators.
Download free 90-day trial versions of the most popular TI software and handheld emulators.
Learn about the math and science behind what students are into, from art to fashion and more.
Get ready for back to school with T³™ Webinars to enhance your teaching and TI technology skills.
Get hundreds of video lessons that show how to graph parent functions and transformations.
Update OS, transfer files andtake screen captures for yourTI-Nspire™ CX II graphing calculator.
Texas Intruments
6-8
45 Minutes
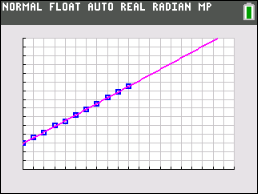
Students determine, by examining a graph, if a data set has a positive or negative correlation coefficient.
Students will graph a scatterplot of data and determine a linear function that describes the data.
Students will determine the equation of a line of best fit to analyze and make predictions about data.Students will graph a scatterplot of data and determine a linear function that describes the data.
Students will interpret the real-world significance of the slope and y-intercept of a linear model.
TI websites use cookies to optimize site functionality and improve your experience. To find out more or to change your preferences, see our cookie policy page. Click Agree and Proceed to accept cookies and enter the site.
You can control your preferences for how we use cookies to collect and use information while you're on TI websites by adjusting the status of these categories.