
Keep It Bottled Up: Linear Rates of Pressure Increase
Science: Chemistry: Gases, Liquids and Solids
9-12
60 Minutes
TI Connect™ CE
TI-84 series
Sensor - Gas Pressure
- This is Activity 5 from the EXPLORATIONS Book: Real World Math Made Easy
- TI-83 Plus or TI-84 Plus
- Plastic tubing
- Empty 500 mL container
- One-hole rubber stopper
- Water, room-temperature
- Warmed effervescent antacid tablets
- Safety goggles
Lessons
Data Collection
Keep It Bottled Up: Linear Rates of Pressure Increase
Activity Overview
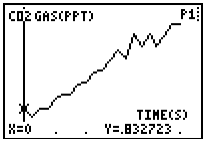
In this activity, you will see how temperature affects the rate at which an effervescent antacid tablet reacts with water and releases a gas. The rate at which the reaction occurs is measured by the rate of gas production.
Science: Chemistry: Gases, Liquids and Solids
9-12
60 Minutes
TI Connect™ CE
TI-84 series
Sensor - Gas Pressure
- This is Activity 5 from the EXPLORATIONS Book: Real World Math Made Easy
- TI-83 Plus or TI-84 Plus
- Plastic tubing
- Empty 500 mL container
- One-hole rubber stopper
- Water, room-temperature
- Warmed effervescent antacid tablets
- Safety goggles
Lessons
Data Collection
iPad is a trademark of Apple Inc., registered in the U.S. and other countries.
Vernier EasyData,Vernier EasyLink and Vernier EasyTemp are registered trademarks of Vernier Science Education.
Vernier EasyData,Vernier EasyLink and Vernier EasyTemp are registered trademarks of Vernier Science Education.