Why t?

TI-Nspire™ CX CAS
Why t?
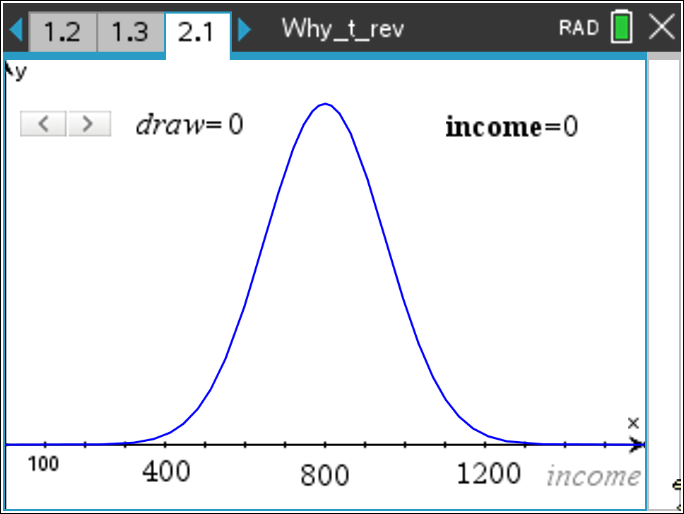
This lesson involves examining the variability of individual elements and their related standardized test statistics when those elements are drawn randomly from a given normally-distributed population.
- Students will recognize that when the population standard deviation is unknown, it must be estimated from the sample in order to calculate a standardized test statistic.
- Students will recognize that when the population standard deviation is known, the standardized test statistic for a sample mean (z-score) is unusual only when the sample mean itself is unusual (far from the population mean).
- Students will recognize that when the population standard deviation is unknown, the standardized test statistic for a sample mean (t-score) can be unusual for either of two reasons:
- because the sample mean itself is unusual (far from the population mean), or
- because the standard deviation of the sample (estimate of population sd) is small.
- Students will recognize that estimating the population standard deviation increases the variability of the sampling distribution of the standardized test statistic for sample means.
- hypothesis test
- mean
- population
- sample
- sampling distribution
- standard deviation
- standardized test statistic
- t-score
- z-score
This lesson involves examining the variability of individual elements and their related standardized test statistics when those elements are drawn randomly from a given normally-distributed population.
As a result, students will:
- Confirm that individual elements having large standardized test statistic values (z-scores) are exactly the elements that are far from the population mean.
- Observe that large standardized test statistics for sample means (z-scores) are directly associated with samples having means far from the population mean.
- Calculate the standardized test statistic for samples taken from a population whose standard deviation is not known (t-score) and note that it requires including an estimate for the population standard deviation obtained from the sample itself, namely the sample standard deviation.
- Observe that large values for the standardized test statistic when the population standard deviation is not known (t-scores) occur much more frequently than in normal distributions.
- Conclude that the normal distribution no longer describes the sampling distribution of standardized statistics when the population standard deviation is not known. The proper distribution in this case is called the t distribution.
TI-Nspire™ CX CAS
Vernier EasyData,Vernier EasyLink and Vernier EasyTemp are registered trademarks of Vernier Science Education.

