
Tossing Dice
Math: Statistics: Probability and Random Variables
9-12
45 Minutes
TI-Nspire™ CX series
TI-Nspire™ CX CAS/CX II CAS
3.0
Lessons
TNS
Tossing Dice
Activity Overview
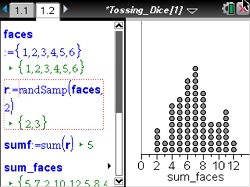
This lesson involves simulating tossing two fair dice, recording the sum of the faces, and creating a dotplot of the sums.
Objectives
- Students will estimate the probability of outcomes from a dotplot.
- Students will compare a simulated sampling distribution to the theoretical distribution for the underlying relationship and note that the simulated distribution will more closely approximate the theoretical after a large number of samples.
Vocabulary
- dice
- dotplot
- faces of a die
- probability of an outcome
- simulated sampling distribution
- theoretical distribution
About the Lesson
This lesson involves simulating tossing two fair dice, recording the sum of the faces, and creating a dotplot of the sums.
As a result, students will:
- Observe how the simulated sampling distribution for the sums of the faces changes as the number of samples is increased.
- Compare their distribution of the sums of the faces of two randomly-tossed dice to their classmates' distributions, and observe how the distributions are alike and how they differ.
- Answer probability questions based on a dotplot of the sums of the faces of two randomly-tossed fair dice.
- Compare the distribution of the sums of the faces from two randomly-tossed fair dice to the theoretical distribution for the sums of the faces.
Math: Statistics: Probability and Random Variables
9-12
45 Minutes
TI-Nspire™ CX series
TI-Nspire™ CX CAS/CX II CAS
3.0
Lessons
TNS
iPad is a trademark of Apple Inc., registered in the U.S. and other countries.
Vernier EasyData,Vernier EasyLink and Vernier EasyTemp are registered trademarks of Vernier Science Education.
Vernier EasyData,Vernier EasyLink and Vernier EasyTemp are registered trademarks of Vernier Science Education.