
Exploring Bivariate Data
Math: Middle Grades Math: Statistics and Probability
6-8
45 Minutes
TI-Nspire™ CX series
TI-Nspire™ CX CAS/CX II CAS
TI-Nspire™ Apps for iPad®
3.6
Lessons
TNS
Exploring Bivariate Data
Activity Overview
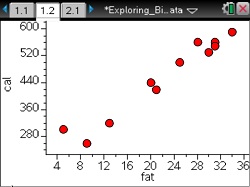
This lesson involves investigating patterns of association in various sets of bivariate data.
Objectives
- Students will construct and interpret scatter plots for bivariate measurement data to investigate patterns of association between two quantities.
- Students will informally explore the role of influential points in determining the patterns of association between two quantities.
Vocabulary
- bivariate data
- scatter plot
- clusters
- influential points
- outliers
- linear/non-linear association
- positive/negative association
- out-of-pattern outliers
About the Lesson
This lesson involves investigating patterns of association in various sets of bivariate data.
As a result, students will:
- Construct the scatter plot for the data.
- Informally analyze any relationship between the two quantities, including analysis of clustering, influential points, and possible out-of-pattern outliers.
- Work with data demonstrating a positive linear association, a negative association, no association, a non-linear negative association, and a non-causal association.
Download Files
Math: Middle Grades Math: Statistics and Probability
6-8
45 Minutes
TI-Nspire™ CX series
TI-Nspire™ CX CAS/CX II CAS
TI-Nspire™ Apps for iPad®
3.6
Lessons
TNS
iPad is a trademark of Apple Inc., registered in the U.S. and other countries.
Vernier EasyData,Vernier EasyLink and Vernier EasyTemp are registered trademarks of Vernier Science Education.
Vernier EasyData,Vernier EasyLink and Vernier EasyTemp are registered trademarks of Vernier Science Education.