One Year Makes a Difference

One Year Makes a Difference
This lesson involves drawing informal comparative inferences about two populations.
- Students will construct and interpret box plots and histograms of data to draw informal comparisons about two populations.
- Students will compare using medians, quartiles, maximums, minimums, ranges, interquartile ranges, and shapes and clustering patterns found in distributions.
- box plot
- histogram
- median
- mean
- lower and upper Quartiles
- Interquartile Range (IQR)
- outlier
- bin width
This lesson involves drawing informal comparative inferences about two populations.
As a result, students will:
- Construct the box plots and histograms to informally compare two samples of data.
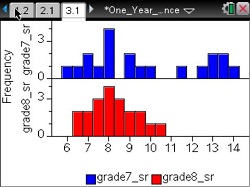
- Compare the bench press strengths of seventh and eighth grade males, the heights of seventh and eighth grade females, and the shuttle times of seventh and eighth grade males with a focus on medians, quartiles, minimums, maximums and the shapes of distributions.
- Compute, by hand, the five number summaries without technology and then confirm using technology.
Vernier EasyData,Vernier EasyLink and Vernier EasyTemp are registered trademarks of Vernier Science Education.

