
Match the Graph-84
Math: Algebra I: Linear Functions
9-12
60 Minutes
TI Connect™
TI-84 Plus CE Python
TI-84 series
CBR™ 2 motion sensor
Lessons
Data Collection
Match the Graph-84
Activity Overview
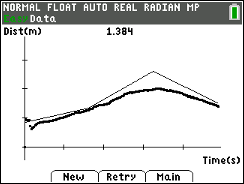
Students walk in front of a calculator-based ranger CBR™ 2 and try to match a distance-time graph. They examine the rate of change, and analyze and interpret the graph of a function.
During the Activity
Distribute the Student Activity PDF to the class.
After the Activity
Download Files
During the Activity Files
Math: Algebra I: Linear Functions
9-12
60 Minutes
TI Connect™
TI-84 Plus CE Python
TI-84 series
CBR™ 2 motion sensor
Lessons
Data Collection
iPad is a trademark of Apple Inc., registered in the U.S. and other countries.
Vernier EasyData,Vernier EasyLink and Vernier EasyTemp are registered trademarks of Vernier Science Education.
Vernier EasyData,Vernier EasyLink and Vernier EasyTemp are registered trademarks of Vernier Science Education.