
Creating Boxes
Math: Middle Grades Math: Algebraic Thinking
Math: Middle Grades Math: Functions
6-8
100 Minutes
TI-84 series
Lessons
Creating Boxes
Activity Overview
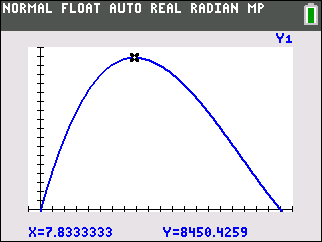
Students graph the relationship between the length of the sides of the cut-out squares and the volume of the resulting box. They trace the graph to decide the best square-size which can result in a box of maximum volume.
Download Files
Teacher Files
Student Files
Math: Middle Grades Math: Algebraic Thinking
Math: Middle Grades Math: Functions
6-8
100 Minutes
TI-84 series
Lessons
iPad is a trademark of Apple Inc., registered in the U.S. and other countries.
Vernier EasyData,Vernier EasyLink and Vernier EasyTemp are registered trademarks of Vernier Science Education.
Vernier EasyData,Vernier EasyLink and Vernier EasyTemp are registered trademarks of Vernier Science Education.