
Dinner Party
Math: Algebra I: Linear Functions
9-12
30 Minutes
TI-Nspire™ CX series
TI-Nspire™ CX CAS/CX II CAS
3.2
Lessons
TNS
Dinner Party
Activity Overview
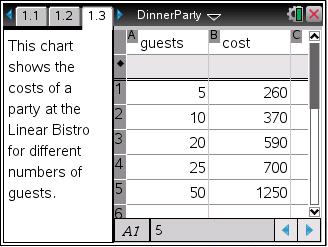
Students investigate the total cost of a private party at three restaurants and then model the cost of a party at each restaurant with the graph of a linear function.
Download Files
Teacher Files
Student Files
Math: Algebra I: Linear Functions
9-12
30 Minutes
TI-Nspire™ CX series
TI-Nspire™ CX CAS/CX II CAS
3.2
Lessons
TNS
iPad is a trademark of Apple Inc., registered in the U.S. and other countries.
Vernier EasyData,Vernier EasyLink and Vernier EasyTemp are registered trademarks of Vernier Science Education.
Vernier EasyData,Vernier EasyLink and Vernier EasyTemp are registered trademarks of Vernier Science Education.