
Square it Up!
Square it Up!
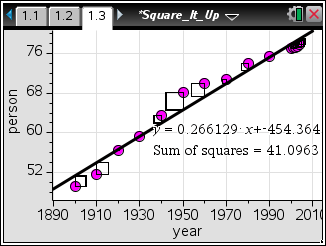
Students investigate the method of least squares by adding the squares to a scatter plot and moving a line to find the minimum sum. Then they compare their line to the built-in linear regression model.
- Students will represent data on a scatter plot, and they will analyze the relationship between the variables.
- Students will fit a linear function to a scatter plot and analyze the fit by plotting residuals.
- Students will model data with mathematical equations and use appropriate technology tools strategically.
- scatter plot
- linear regression
- least squares regression
- residual
In this activity, students will draw a scatter plot and a movable line. They will investigate the method of least squares by adding the squares to the scatter plot and moving the line to find the minimum sum. Students will then compare their line to the built-in linear regression model.
This activity is intended to be student-centered. The worksheet is designed for students to work independently, and then answer a set of inquiry questions with a partner.
Vernier EasyData,Vernier EasyLink and Vernier EasyTemp are registered trademarks of Vernier Science Education.