
Graphing Linear Inequalities Reference and Practice Sheets
9-12
Graphing Linear Inequalities Reference and Practice Sheets
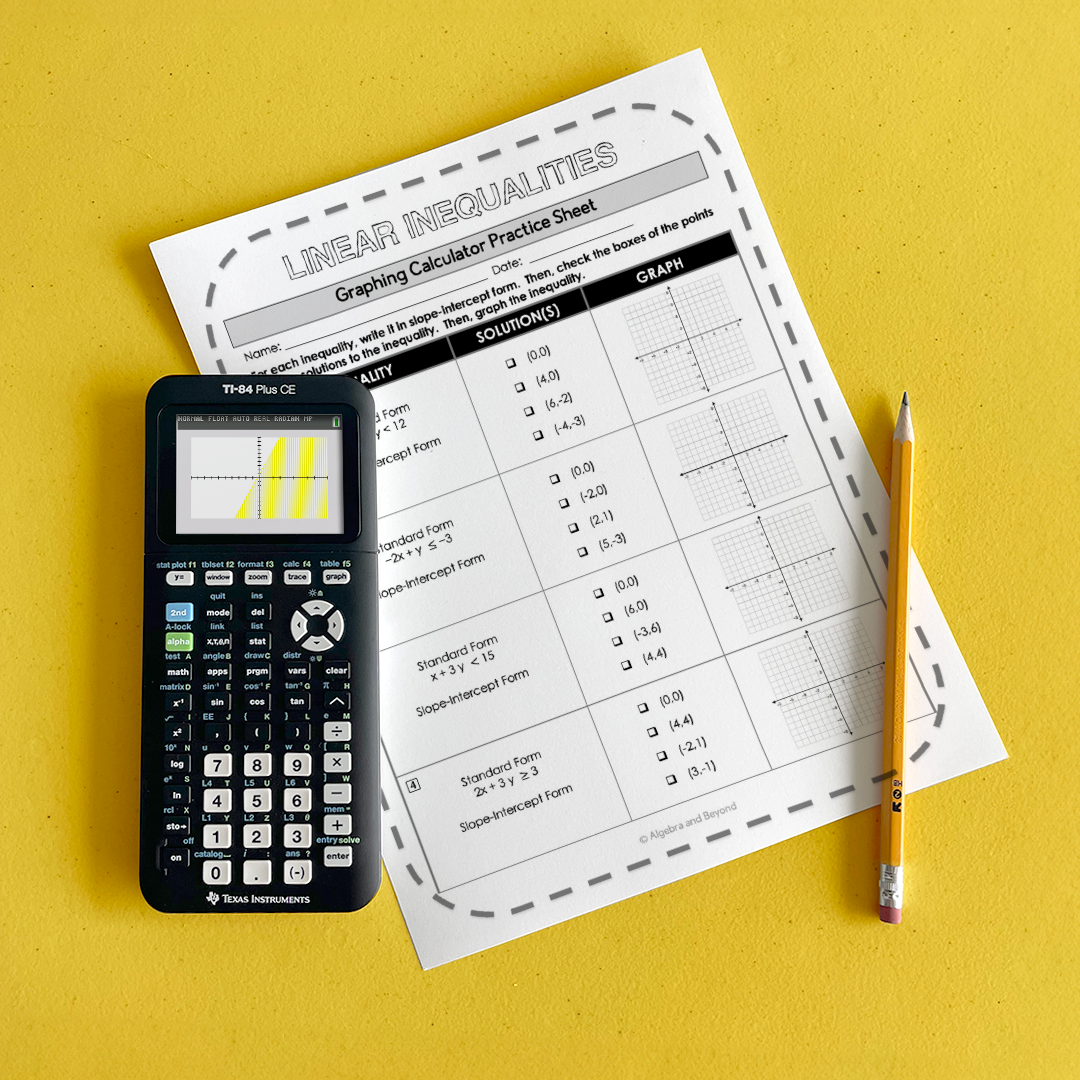
Give students a straightforward, step-by-step guide on graphing linear inequalities and how to find solutions.
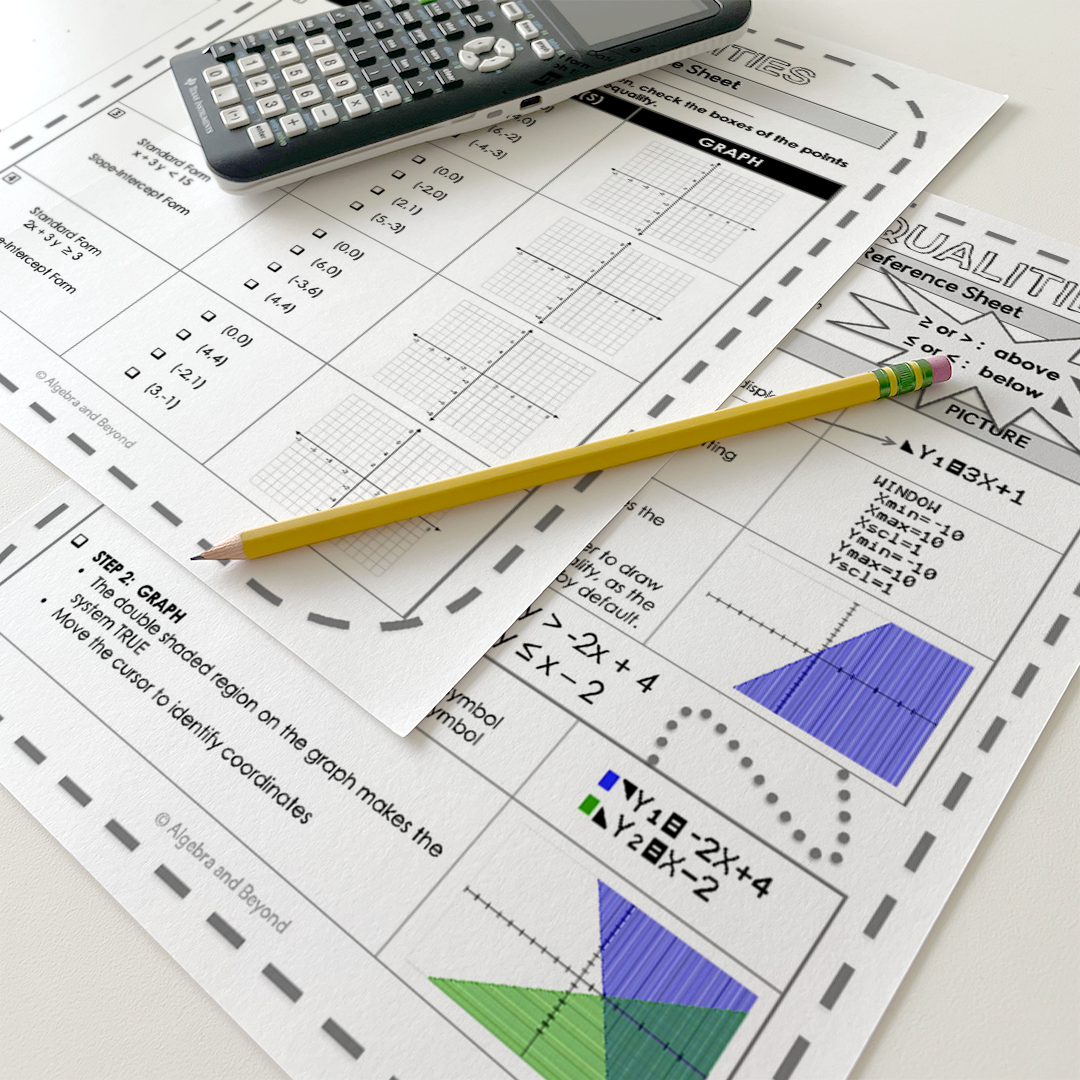
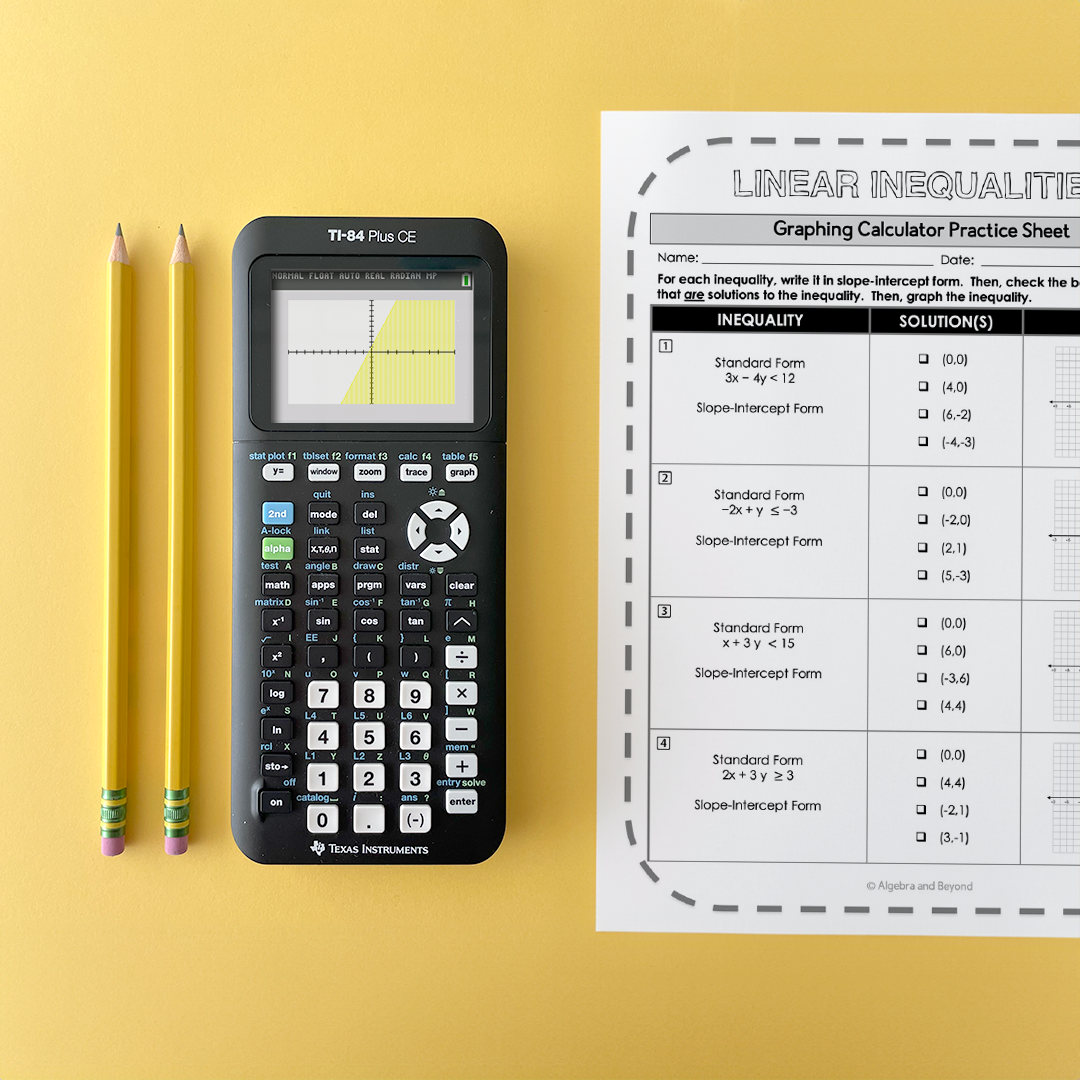
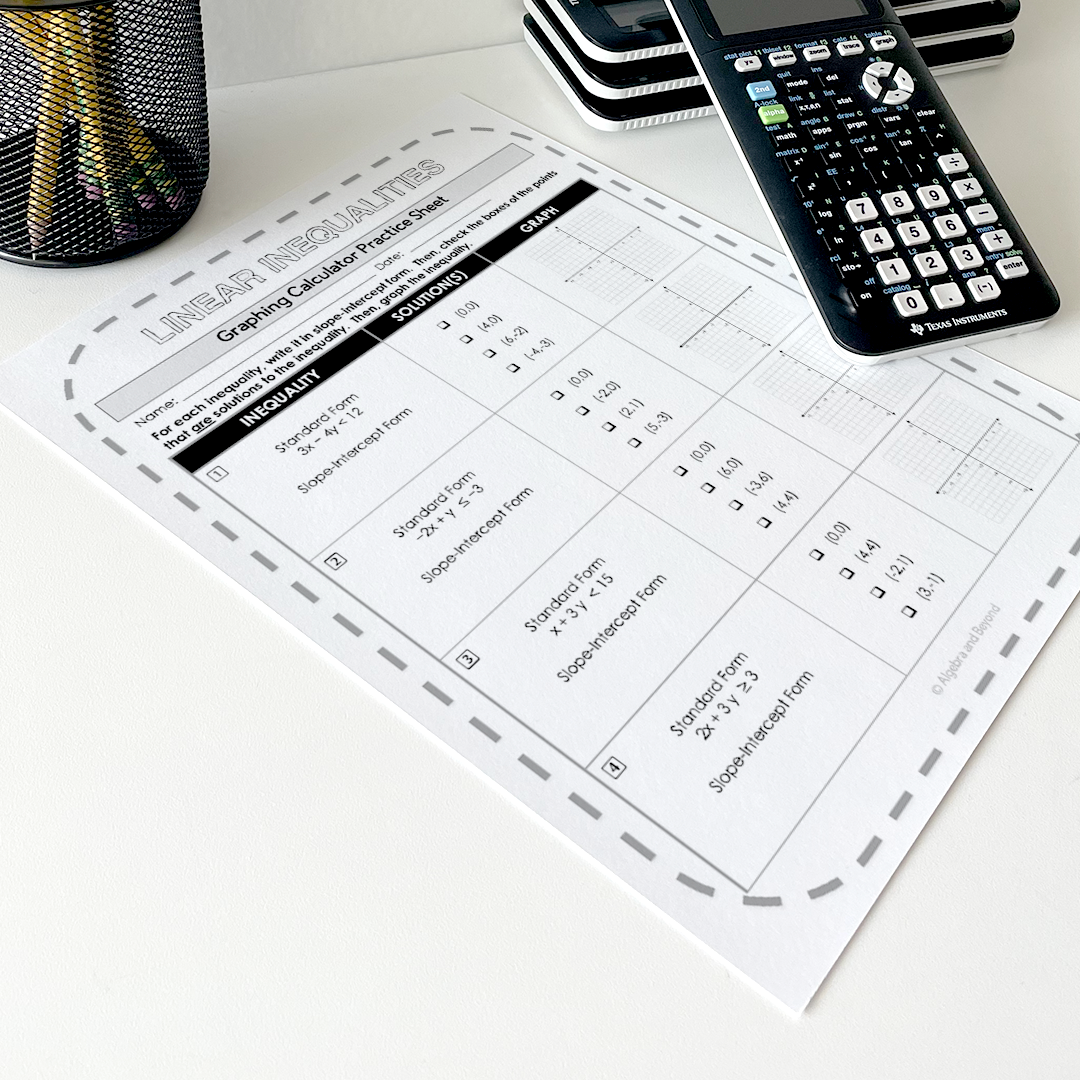
These easy, print-ready reference and practice sheets offer students a simple guide on graphing linear inequalities, systems of linear inequalities, and determining solutions with the TI-84 Plus CE graphing calculator.
Created by Tyra (@algebraandbeyond), a math and business teacher with over 10 years of experience, these sheets can be easily added to students’ math notebooks. Watch their confidence and accuracy soar as they work independently through linear inequalities!
This activity will help students:
- Increase Speed: Compute, graph and create a table of values quickly and efficiently.
- Build Connections: Make connections between different mathematical models — quickly maneuver among tabular, graphical and algebraic forms.
- Check for Accuracy: Check their work — confirm or disaffirm solutions.
- Leap Over Hurdles: Use technology to close gaps.
Standards:
CCSS HSA-REI.D.12 – Graph the solutions to a linear inequality in two variables as a half-plane (excluding the boundary in the case of a strict inequality), and graph the solution set to a system of linear inequalities in two variables as the intersection of the corresponding half-planes.
CCSS MP5 – Use appropriate tools strategically.
These reference and practice sheets are part of the Calculated Collection, featuring easy-start activities made by teachers for today's differentiated classrooms.
What is included in the download:
- Reference sheet with step-by-step instructions
- Practice sheet with problems for students to review
- Google Slides digital versions
9-12
Vernier EasyData,Vernier EasyLink and Vernier EasyTemp are registered trademarks of Vernier Science Education.