
Exploring the Area Under a Curve
Math: Calculus: Antiderivatives and Slope Fields
Math: Calculus: Limits of Functions
Math: AP Calculus: AP Calculus
9-12
45 Minutes
TI-89 / TI-89 Titanium
Lessons
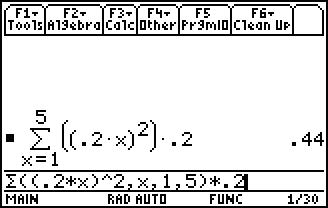
Exploring the Area Under a Curve
Activity Overview
Students explore Riemann sums to find the approximate area under the graph of a parabola on the interval [0, 1].
Download Files
Teacher Files
Student Files
Math: Calculus: Antiderivatives and Slope Fields
Math: Calculus: Limits of Functions
Math: AP Calculus: AP Calculus
9-12
45 Minutes
TI-89 / TI-89 Titanium
Lessons
iPad is a trademark of Apple Inc., registered in the U.S. and other countries.
Vernier EasyData,Vernier EasyLink and Vernier EasyTemp are registered trademarks of Vernier Science Education.
Vernier EasyData,Vernier EasyLink and Vernier EasyTemp are registered trademarks of Vernier Science Education.