
How High Will it Bounce?
How High Will it Bounce?
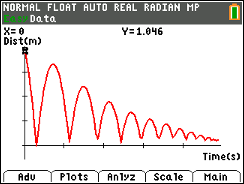
Students collect the height versus time data of a bouncing ball using the CBR 2™. They find the relationship between the bounce number and the bounce height. They also learn to graph scatter plots, calculate the maximum value of a parabola, analyze and find an exponential regression for the rebound height.
When a ball is dropped, it does not rebound to the same height from which it is dropped. But how high does it bounce? In this activity, students will examine the relationship for maximum bounce height as a function of bounce number for a ball bouncing under a motion sensor. The equation that describes this height versus bounce number relationship is an exponential equation of form y = a(b)x, where a is the initial drop height and b is the average rebound percentage. Students will:
- Collect motion data and graph scatter plots.
- Determine the maximum height of each bounce.
- Compute the ratio of the height of each bounce to the height of the preceding bounce to determine rebound percentages.
- Determine the average rebound percentage.
- Use the average rebound percentage and the height of the first bounce to estimate the initial drop height.
- Determine the exponential equation that describes the relationship between bounce number and the maximum height of each bounce.
Vernier EasyData,Vernier EasyLink and Vernier EasyTemp are registered trademarks of Vernier Science Education.