Random Samples

Random Samples
Compare the results of the three estimation methods to show that random samples of rectangles provide estimates that, on average, are closer to the true population mean than the other two methods.
- Students will describe the meaning of bias in estimation.
- Students will recognize that the mean of a random sample is an unbiased estimator for the population mean.
- Students will recognize that estimates of the population mean using expert judgment can be biased.
- Students will recognize that the mean of a sample obtained using non-random sampling methods can be a biased estimator of the population mean.
- bias
- convenience sample
- mean
- random sample
This lesson involves approximating the mean of a variable.
As a result, students will:
- View a collection of rectangles and create an informal estimate of their mean area.
- Use the mean of a convenience sample as an estimate of the mean area of the entire collection.
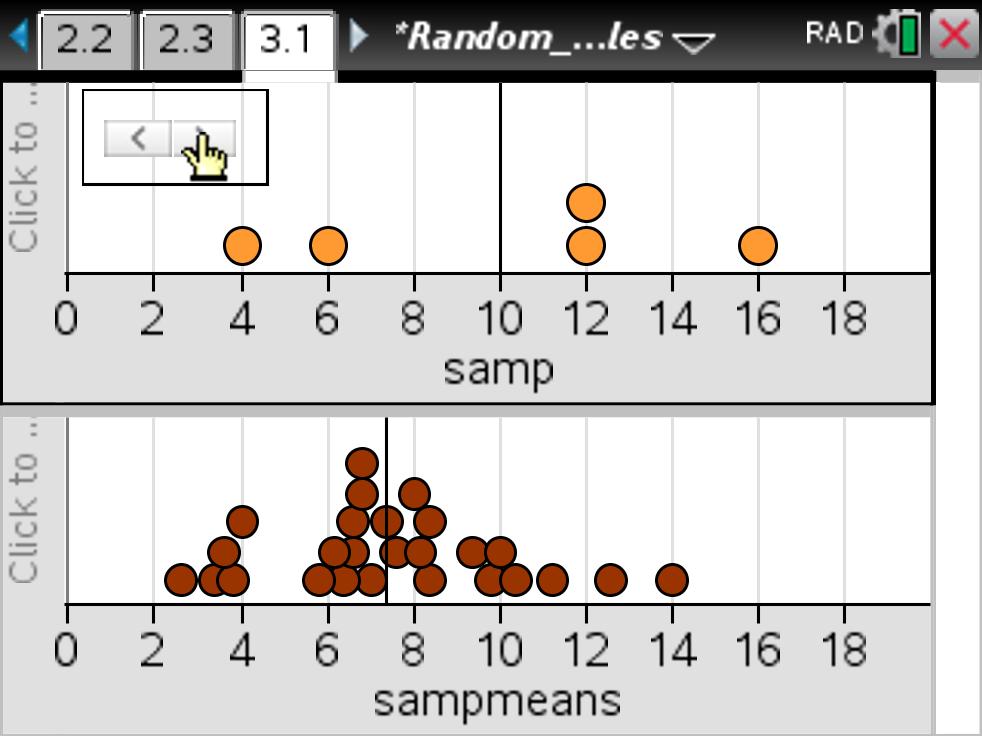
- Use the mean of a random sample as an estimate of the mean area of the entire collection.
- Compare the collective results of the three estimation methods across the class to deduce that random samples provide estimates that, on average, are closer to the true population mean than the other two methods.
Vernier EasyData,Vernier EasyLink and Vernier EasyTemp are registered trademarks of Vernier Science Education.

