Proportions in Stories

Proportions in Stories
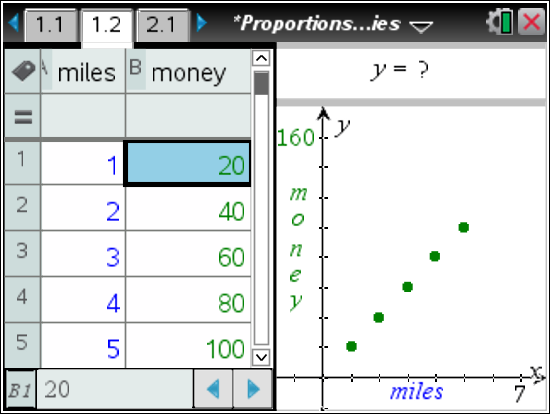
This lesson involves inputting data into a table, observing the data on coordinate plane, and inputting an equation that corresponds with the table of values.
- Students will construct a data table, analyze the scatter plot of the data, develop an equation to describe the data, and graph the equation to verify that it represents the data.
- Students will compare and contrast proportional and non-proportional linear relationships in real-life stories represented by a table, an equation, and a graph.
- Students will identify characteristics of proportional relationships by analyzing a table, equation, and graph.
- Students will analyze tables, equations, and graphs to determine if two quantities are in a proportional relationship.
- proportional
- non-proportional
- slope
- y-intercept
- constant rate of change
- ratio
This lesson involves inputting data into a table, observing the data on coordinate plane, and inputting an equation that corresponds with the table of values.
As a result, students will:
- Analyze three real-life situations, two that represent proportional relationships and one that represents a non-proportional linear situation.
- Determine characteristics of proportional relationships given in multiple representations, such as verbal, numerical, algebraic, and graphical.
Vernier EasyData,Vernier EasyLink and Vernier EasyTemp are registered trademarks of Vernier Science Education.

