
MVT for Integrals
Math: Calculus: Definite Integrals and Applications
Math: AP Calculus: AP Calculus
9-12
45 Minutes
TI-Nspire™ Apps for iPad®
TI-Nspire™ CX series
TI-Nspire™ CX CAS/CX II CAS
3.2
Lessons
TNS
MVT for Integrals
Activity Overview
Demonstrate how the average value of a function over an interval is related to the definite integral.
Objectives
- Describe the statement of the Mean Value Theorem for Integrals in terms of graphical representation
- Describe how the Mean Value Theorem for Integrals relates to the average value of a function
- Explain why the condition of continuity is needed in the hypothesis of the Mean Value Theorem for Integrals to guarantee the existence of a point at which the function attains its average value
Vocabulary
- definite integral
- average value of a function
About the Lesson
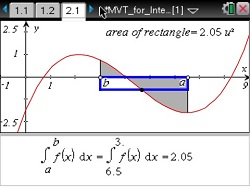
This lesson provides a graphical representation of the Mean Value Theorem for Integrals to demonstrate how the average value of a function over an interval is related to the definite integral. As a result, students will:
- Change the endpoints of intervals to make connections between the definite integral (the area bounded by the graph of f(x) and the x-axis) and a corresponding rectangular area.
- Discover that if a function f(x) is continuous it is always possible to construct a rectangle of height f(c) such that its area is equal to the definite integral and that this value f(c) is the average value of the function over the given interval.
- Use graphical representations of the Mean Value Theorem for Integrals to determine the average value of functions.
- Recognize conditions under which the existence conclusion of the Mean Value Theorem does not hold.
Download Files
Math: Calculus: Definite Integrals and Applications
Math: AP Calculus: AP Calculus
9-12
45 Minutes
TI-Nspire™ Apps for iPad®
TI-Nspire™ CX series
TI-Nspire™ CX CAS/CX II CAS
3.2
Lessons
TNS
iPad is a trademark of Apple Inc., registered in the U.S. and other countries.
Vernier EasyData,Vernier EasyLink and Vernier EasyTemp are registered trademarks of Vernier Science Education.
Vernier EasyData,Vernier EasyLink and Vernier EasyTemp are registered trademarks of Vernier Science Education.