Lines of Fit

Lines of Fit
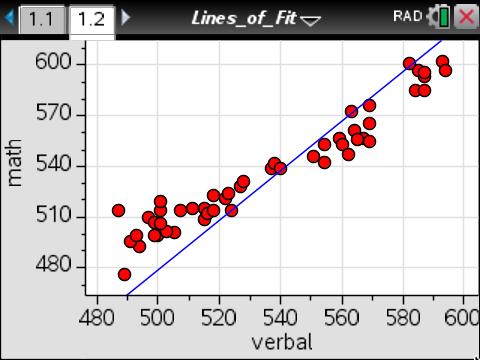
This lesson involves informally fitting a straight line for a given data set that represents mean verbal and mathematics scores on SAT in 2004 across all 50 states and Washington, D.C.
- Students will discover that straight lines are widely used to model relationships between two quantitative variables.
- Students will informally fit a straight line and assess the model fit by judging the closeness of the data points to the line for scatter plots that suggest a linear association.
- Students will reason abstractly and quantitatively.
- Students will construct viable arguments and critique the reasoning of others.
- line of fit
This lesson involves informally fitting a straight line for a given data set that represents mean verbal and mathematics scores on SAT in 2004 across all 50 states and Washington, D.C.
As a result, students will:
- Rotate and translate a line to fit a linear model to the scatter plot of the given data set.
- Discuss criteria for a good fit.
- Use the line of fit to make estimations and predictions.
Vernier EasyData,Vernier EasyLink and Vernier EasyTemp are registered trademarks of Vernier Science Education.

