Introduction to Quadratic Equations

9-12
Introduction to Quadratic Equations
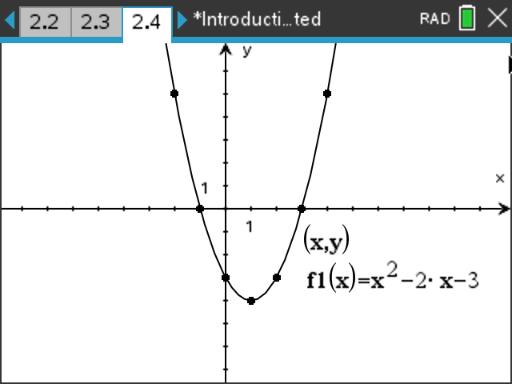
This activity allows students to gain an understanding of quadratic equations. They will begin by using a Lists and Spreadsheet page to find the y-values of a specific function. They will then plot the x and y-values using a scatter plot to see the shape of the parabola. On top of this scatter plot, they will graph the function. They will then graph a quadratic equation and explore the graph to find the maximum or minimum and the roots and look at the function table.
Before the activity, students should know how to graph a line using a table and how to graph a line by typing in the function.
This activity is meant to be teacher-led with the students following along on their handheld. There is no student worksheet, because they will be doing all of the exploration on their handheld. The .tns file and a copy of a completed .tns file are also attached.
Before the Activity Files
9-12
Vernier EasyData,Vernier EasyLink and Vernier EasyTemp are registered trademarks of Vernier Science Education.

