
Influencing Regression
Math: Statistics: Describing Bivariate Data
9-12
50 Minutes
TI-Nspire™ Apps for iPad®
TI-Nspire™ CX series
TI-Nspire™ CX CAS/CX II CAS
3.2
Lessons
TNS
Influencing Regression
Activity Overview
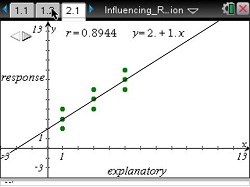
This lesson involves a least-squares regression line fit to a set of nine values.
Objectives
- Students will recognize that one point can influence the correlation coefficient and the least-squares regression line.
- Students will differentiate between an outlier and an influential point with respect to the least-squares regression line.
Vocabulary
- correlation coefficient
- influential point
- least-squares regression line
- outlier
- scatterplot
- slope
- centroid (optional)
About the Lesson
This lesson involves a least-squares regression line fit to a set of nine values.
As a result, students will:
- Add a value to the data set and observe how the least-squares regression line and the correlation coefficient change.
- Determine a value that could be added to the data set to make the correlation coefficient close to zero, to make it close to one, or to change the sign of the correlation coefficient from a positive value to a negative value.
- Determine a value that could be added to the data set without changing the equation of the least-squares regression line or the correlation coefficient.
Download Files
Math: Statistics: Describing Bivariate Data
9-12
50 Minutes
TI-Nspire™ Apps for iPad®
TI-Nspire™ CX series
TI-Nspire™ CX CAS/CX II CAS
3.2
Lessons
TNS
iPad is a trademark of Apple Inc., registered in the U.S. and other countries.
Vernier EasyData,Vernier EasyLink and Vernier EasyTemp are registered trademarks of Vernier Science Education.
Vernier EasyData,Vernier EasyLink and Vernier EasyTemp are registered trademarks of Vernier Science Education.