Graphing Relationships

TI-Nspire™ CX CAS
Graphing Relationships
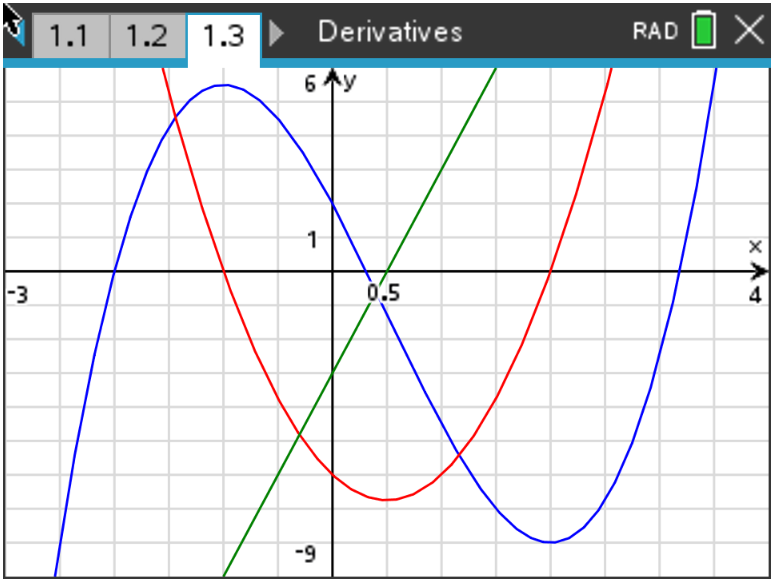
In this activity, students will examine the graphs of functions along with their derivatives and look for relationships that exist.
Students will:
- Realize information about a graph based on the first and second derivatives.
- Learn that a function’s derivative is positive when the function increases and negative when the function decreases.
- Learn that the second derivative is positive when the graph is concave upward and negative when the graph is concave downward.
- derivatives
- concavity
- relative/local maximum
- relative/local minimum
Students can complete this activity independently but may benefit from the discussion that occurs when working in a small group.
Students should be able to understand how the first derivative provides information about where the function is increasing or decreasing and how the second derivative provides information about the concavity of the graph. Many students can understand that when a function is increasing, the derivative is positive, but they cannot correctly interpret what that means on a graph. Instead of understanding that this means the graph is always above the x-axis, some students may think that the derivative is increasing.
TI-Nspire™ CX CAS
Vernier EasyData,Vernier EasyLink and Vernier EasyTemp are registered trademarks of Vernier Science Education.

